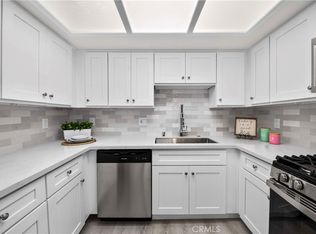
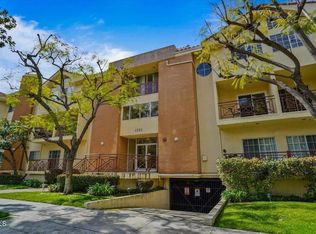
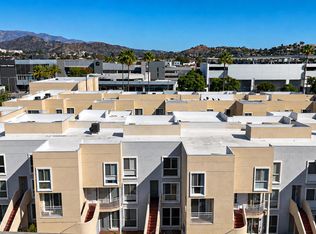
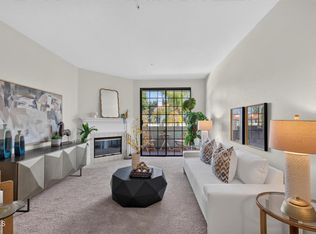
Rare Rossmoyne opportunity below $635K! This desirable corner-end, two-story townhome-style residence offers exceptional privacy with NO shared walls along the main living level. Features include soaring vaulted ceilings, an upstairs primary suite overlooking the pool, private balcony, interior laundry, two secured garage parking spaces, and private storage. Recent upgrades include a new high-efficiency rooftop A/C and a fully prepaid $4,700 roof assessment—no cost to the buyer. Enjoy a low $320/month HOA covering water, maintenance, pool, and community amenities. Conveniently located near Trader Joe’s, parks, shopping, and dining in Glendale’s sought-after Rossmoyne neighborhood!
For sale
Listed by: Brick and Mortar Real Estate G • Maral Ouzounian • 626-517-7488
Price cut: $667 (11/10)
$633,333
1131 Campbell St APT 212, Glendale, CA 91207
2beds
1,177sqft
Condominium
Built in 1994
-- sqft lot
$645,200 Zestimate®
$538/sqft
$320/mo HOA
What's special
- 3 days
- 252
- 19
Likely to sell faster than
Zillow last checked:
Listing updated:
Listed by:
Maral Ouzounian DRE #02140880 626-517-7488,
Brick and Mortar Real Estate G,
Marie Walker DRE #02133614 408-263-8507,
eXp Realty of Greater Los Angeles, Inc.
Source: CRMLS,MLS#: GD26240936 Originating MLS: California Regional MLS
Facts & features
Interior
Bedrooms & bathrooms
- Bedrooms: 2
- Bathrooms: 3
- Full bathrooms: 3
- Main level bathrooms: 1
Rooms
- Room types: Bedroom, Dining Room
Bedroom
- Features: All Bedrooms Up
Bathroom
- Features: Bathroom Exhaust Fan, Bathtub, Dual Sinks, Separate Shower, Tub Shower
Heating
- Central
Cooling
- Central Air
Appliances
- Included: Dishwasher, Gas Oven, Microwave, Refrigerator, Water Heater, Dryer, Washer
- Laundry: Washer Hookup, Inside
Features
- Separate/Formal Dining Room, High Ceilings, Storage, All Bedrooms Up
- Flooring: Tile, Wood
- Has fireplace: Yes
- Fireplace features: Family Room, Gas Starter
- Common walls with other units/homes: No Common Walls
Interior area
- Total interior livable area: 1,177 sqft
Property
Parking
- Total spaces: 4
- Parking features: Assigned, Garage, Community Structure
- Attached garage spaces: 2
- Carport spaces: 2
- Covered spaces: 4
Features
- Levels: Two
- Stories: 2
- Entry location: Front Door
- Pool features: Community, In Ground, Association
- Has spa: Yes
- Spa features: Community, In Ground
- Has view: Yes
- View description: Pool
Lot
- Size: 0.92 Acres
Details
- Parcel number: 5647010171
- Special conditions: Standard
Construction
Type & style
- Home type: Condo
- Property subtype: Condominium
Condition
- New construction: No
- Year built: 1994
Utilities & green energy
- Sewer: Private Sewer
- Water: Private
Community & HOA
Community
- Features: Curbs, Sidewalks, Pool
- Security: Security Gate
HOA
- Has HOA: Yes
- Amenities included: Maintenance Grounds, Pool, Recreation Room, Spa/Hot Tub, Trash, Water
- HOA fee: $320 monthly
- HOA name: Campbell Park Homeowners Association
- HOA phone: 818-240-6515
Location
- Region: Glendale
Financial & listing details
- Price per square foot: $538/sqft
- Tax assessed value: $242,971
- Date on market: 11/10/2026
- Cumulative days on market: 4 days
- Listing terms: Cash,Cash to New Loan,Conventional
Estimated market value
$645,200
$613,000 - $677,000
$3,349/mo
Price history
| Date | Event | Price |
|---|---|---|
| 11/10/2026 | Price change | $633,333-0.1%$538/sqft |
Source:  CRMLS #GD26240936 Report a problem | ||
| 11/5/2026 | Price change | $634,000-2.3%$539/sqft |
Source:  Greater Palm Springs Realtors #219151919 Report a problem | ||
| 10/5/2026 | Pending sale | $649,000$551/sqft |
Source: Greater Palm Springs Realtors #219151919 Report a problem | ||
| 9/29/2026 | Price change | $649,000-0.7%$551/sqft |
Source: Greater Palm Springs Realtors #219151919 Report a problem | ||
| 9/26/2026 | Price change | $653,9000%$556/sqft |
Source: Greater Palm Springs Realtors #219151919 Report a problem | ||
| 8/27/2026 | Listed for sale | $654,000-12.7%$556/sqft |
Source:  CDAR/ Desert Area MLS #219151919 Report a problem | ||
| 1/4/2026 | Listing removed | $2,790$2/sqft |
Source:  CLAW #25618431PS Report a problem | ||
| 12/15/2025 | Price change | $2,790-3.5%$2/sqft |
Source: CLAW #25618431PS Report a problem | ||
| 11/26/2025 | Price change | $2,890-6.5%$2/sqft |
Source: CLAW #25618431PS Report a problem | ||
| 11/13/2025 | Listed for rent | $3,090+10.4%$3/sqft |
Source: CLAW #25618431PS Report a problem | ||
| 6/26/2022 | Listing removed | -- |
Source: Zillow Rental Manager Report a problem | ||
| 6/10/2022 | Listed for rent | $2,800+22.3%$2/sqft |
Source: Zillow Rental Manager Report a problem | ||
| 1/29/2020 | Listing removed | $2,290$2/sqft |
Source: RE/MAX Tri-City Realty #319004987 Report a problem | ||
| 1/7/2020 | Price change | $2,290-4.2%$2/sqft |
Source: Re/Max Tri-City Realty #319004987 Report a problem | ||
| 12/12/2019 | Price change | $2,390-4.4%$2/sqft |
Source: Owner Report a problem | ||
| 11/30/2019 | Listed for rent | $2,500+16.3%$2/sqft |
Source: Owner Report a problem | ||
| 12/15/2018 | Listing removed | $749,000$636/sqft |
Source: Owner Report a problem | ||
| 12/1/2018 | Listed for sale | $749,000+0.6%$636/sqft |
Source: Owner Report a problem | ||
| 7/26/2018 | Listing removed | $2,150$2/sqft |
Source: JohnHart Real Estate #318002586 Report a problem | ||
| 7/25/2018 | Price change | $2,150-6.5%$2/sqft |
Source: JohnHart Real Estate #318002586 Report a problem | ||
| 7/16/2018 | Price change | $2,300-8%$2/sqft |
Source: JohnHart Real Estate #318002586 Report a problem | ||
| 6/29/2018 | Listed for rent | $2,500-7.4%$2/sqft |
Source: JohnHart Real Estate #318002586 Report a problem | ||
| 9/11/2017 | Listing removed | $744,900$633/sqft |
Source: Owner Report a problem | ||
| 8/10/2017 | Listed for sale | $744,900+380.6%$633/sqft |
Source: Owner Report a problem | ||
| 8/8/2017 | Listing removed | $2,700$2/sqft |
Source: Owner Report a problem | ||
| 7/10/2000 | Sold | $155,000$132/sqft |
Source: Public Record Report a problem | ||
| 12/14/1999 | Sold | $155,000+10.7%$132/sqft |
Source: Public Record Report a problem | ||
| 3/4/1994 | Sold | $140,000$119/sqft |
Source: Public Record Report a problem | ||
Public tax history
| Year | Property taxes | Tax assessment |
|---|---|---|
| 2026 | -- | $242,971 +2% |
| 2025 | $2,738 +2.5% | $238,208 +2% |
| 2024 | $2,671 +2.3% | $233,538 +2% |
| 2023 | $2,611 +1.9% | $228,960 +2% |
| 2022 | $2,563 +1.9% | $224,471 +2% |
| 2021 | $2,515 +1.5% | $220,070 +1% |
| 2020 | $2,478 | $217,815 +2% |
| 2019 | $2,478 +4.1% | $213,545 +2% |
| 2018 | $2,379 | $209,359 +2% |
| 2017 | $2,379 +1.6% | $205,254 +2% |
| 2016 | $2,341 +3.6% | $201,230 +1.5% |
| 2015 | $2,260 +2.7% | $198,208 +2% |
| 2014 | $2,201 | $194,327 +2.5% |
| 2012 | -- | $189,658 +2% |
| 2011 | -- | $185,940 +0.8% |
| 2010 | -- | $184,551 -0.2% |
| 2009 | -- | $184,990 +2% |
| 2008 | -- | $181,363 +2% |
| 2007 | -- | $177,808 +2% |
| 2006 | -- | $174,323 |
| 2005 | -- | $174,323 +4% |
| 2004 | -- | $167,556 +1.9% |
| 2003 | -- | $164,486 +2% |
| 2002 | -- | $161,261 +4% |
| 2000 | -- | $155,000 |
Find assessor info on the county website
Monthly payment
Est. payment
Payment breakdown
Explore the cost of this home by adjusting the details. Changes won't be saved.Climate risks
Neighborhood: Rossmoyne


Similar homes
- $668,0002 bd3 ba1.2k sqft116 W Maple St Unit 21, Glendale, CA 91204For Sale
 MLS ID #P1-29427, Michelle Chavoor, COMPASS. CRMLS
- $599,0002 bd2 ba1.1k sqft245 S Holliston Ave Unit 309, Pasadena, CA 91106For Sale
 MLS ID #P1-28861, Esther Clauson, Keller Williams Los Angeles. CRMLS
- $599,0002 bd2 ba1.2k sqft4700 Natick Ave Unit 310, Sherman Oaks, CA 91403For Sale
 MLS ID #226005258, David Samuels, Keller Williams Westlake Village. CSMAOR
- $655,0001 bd1 ba865 sqft124 W Colorado St APT 108, Glendale, CA 91204For Sale
 MLS ID #P1-28296, Silva Hameline, Hameline Global. CRMLS
