$263,000
3 bd|2 ba|-- sqft
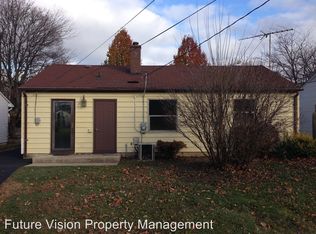
211 S Reed St, Joliet, IL 60436
Sold
Likely to sell faster than
Zillow last checked:
Listing updated:
Matt Kovarik 815-931-1021,
Futurevision, Inc.
Not available
Estimated sales range
Not available
Not available
| Date | Event | Price |
|---|---|---|
| 5/22/2026 | Pending sale | $209,000$232/sqft |
Source: | ||
| 5/20/2026 | Listing removed | $209,000$232/sqft |
Source: | ||
| 5/11/2026 | Pending sale | $209,000$232/sqft |
Source: | ||
| 5/9/2026 | Listed for sale | $209,000+54.8%$232/sqft |
Source: | ||
| 2/18/2020 | Listing removed | $1,100$1/sqft |
Source: Futurevision Inc. #10631336 Report a problem | ||
| 2/8/2020 | Listed for rent | $1,100+7.3%$1/sqft |
Source: Futurevision Inc. #10631336 Report a problem | ||
| 9/29/2014 | Listing removed | $1,025$1/sqft |
Source: Futurevision Property Management Report a problem | ||
| 9/6/2014 | Listed for rent | $1,025$1/sqft |
Source: Futurevision Property Management Report a problem | ||
| 7/1/2014 | Listing removed | $1,025$1/sqft |
Source: Futurevision Property Management Report a problem | ||
| 6/16/2014 | Listed for rent | $1,025+2.5%$1/sqft |
Source: FutureVision Property Management Report a problem | ||
| 4/8/2014 | Listing removed | $1,000$1/sqft |
Source: Futurevision Property Management Report a problem | ||
| 1/14/2014 | Listed for rent | $1,000$1/sqft |
Source: Futurevision Property Management Report a problem | ||
| 12/20/2006 | Sold | $135,000+45.2%$150/sqft |
Source: Public Record Report a problem | ||
| 9/13/2002 | Sold | $93,000$103/sqft |
Source: Public Record Report a problem | ||
| Year | Property taxes | Tax assessment |
|---|---|---|
| 2024 | $4,809 +5.7% | $57,419 +12.6% |
| 2023 | $4,551 +6.8% | $51,016 +10.6% |
| 2022 | $4,262 +5.2% | $46,147 +7.1% |
| 2021 | $4,050 +5.4% | $43,099 +5.3% |
| 2020 | $3,843 +5.1% | $40,930 +7.6% |
| 2019 | $3,655 +7.6% | $38,039 +11.5% |
| 2018 | $3,398 +6.1% | $34,106 +10% |
| 2017 | $3,203 +7.8% | $31,008 +12.1% |
| 2016 | $2,972 +7.5% | $27,651 +10.4% |
| 2015 | $2,765 | $25,050 -5.1% |
| 2014 | $2,765 -14% | $26,400 -14.4% |
| 2013 | $3,214 +1.3% | $30,851 -7.9% |
| 2012 | $3,172 +1.2% | $33,512 -10.3% |
| 2011 | $3,135 -2.5% | $37,350 -10.5% |
| 2010 | $3,214 +0.3% | $41,718 -7.5% |
| 2009 | $3,204 +3.7% | $45,100 |
| 2008 | $3,090 | $45,100 +7% |
| 2007 | -- | $42,150 +6.3% |
| 2006 | $2,477 +9.2% | $39,650 +10.9% |
| 2005 | $2,268 +17.4% | $35,738 +17.4% |
| 2004 | $1,932 -1.9% | $30,441 +4.1% |
| 2003 | $1,968 +23.6% | $29,250 +13.2% |
| 2002 | $1,592 +37.7% | $25,850 +4% |
| 2001 | $1,156 +1.9% | $24,860 +3% |
| 2000 | $1,135 | $24,136 |
Find assessor info on the county website
Source: MRED as distributed by MLS GRID. This data may not be complete. We recommend contacting the local school district to confirm school assignments for this home.
A local agent can set up tours, give advice and negotiate with sellers.
A local lender can help you make sure your offer is ready when you are.