$450,000
3 bd|2 ba|1.6k sqft
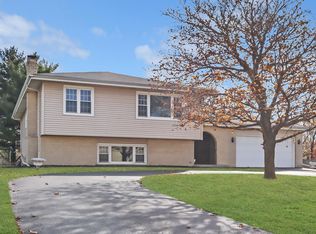
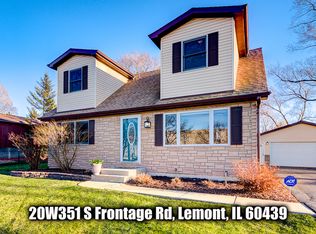
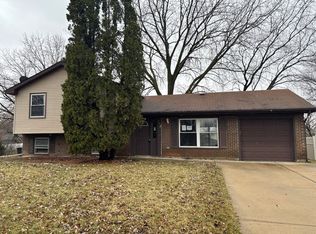
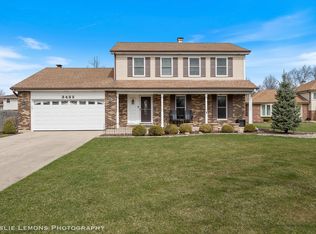
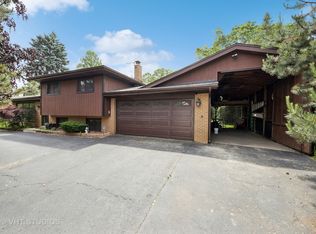
20W315 S Frontage Rd, Lemont, IL 60439
Sold
Zillow last checked: 7 hours ago
Listing updated: March 17, 2026 at 10:06pm
Svetlana Cole 630-447-8382,
Charles Rutenberg Realty of IL
Not available
Estimated sales range
Not available
Not available
| Date | Event | Price |
|---|---|---|
| 3/13/2026 | Listed for sale | $499,000+66.9%$270/sqft |
Source: | ||
| 4/28/2020 | Listing removed | $299,000$162/sqft |
Source: Charles Rutenberg Realty of IL #10679559 Report a problem | ||
| 3/30/2020 | Price change | $299,000-3.5%$162/sqft |
Source: Charles Rutenberg Realty of IL #10679559 Report a problem | ||
| 3/9/2020 | Price change | $309,900-1.9%$168/sqft |
Source: Charles Rutenberg Realty of IL #10590158 Report a problem | ||
| 3/7/2020 | Price change | $316,000-0.6%$171/sqft |
Source: Charles Rutenberg Realty of IL #10590158 Report a problem | ||
| 1/1/2020 | Listed for sale | $318,000$172/sqft |
Source: Charles Rutenberg Realty of IL #10590158 Report a problem | ||
| 12/23/2019 | Pending sale | $318,000$172/sqft |
Source: Charles Rutenberg Realty of IL #10590158 Report a problem | ||
| 12/10/2019 | Listed for sale | $318,000+6.4%$172/sqft |
Source: Charles Rutenberg Realty of IL #10590158 Report a problem | ||
| 10/30/2019 | Listing removed | $298,900$162/sqft |
Source: Charles Rutenberg Realty of IL #10512240 Report a problem | ||
| 9/20/2019 | Price change | $298,900-6.6%$162/sqft |
Source: Charles Rutenberg Realty of IL #10512240 Report a problem | ||
| 9/9/2019 | Listed for sale | $319,950$173/sqft |
Source: Charles Rutenberg Realty of IL #10512240 Report a problem | ||
| Year | Property taxes | Tax assessment |
|---|---|---|
| 2023 | -- | $101,180 +11.1% |
| 2022 | $4,933 +18.1% | $91,080 +1.2% |
| 2021 | $4,178 -12.4% | $90,040 +2% |
| 2020 | $4,772 +4.6% | $88,260 |
| 2019 | $4,561 +25.8% | -- |
| 2018 | $3,625 -13.6% | $80,090 +3.9% |
| 2017 | $4,195 -1.8% | $77,070 +4.8% |
| 2016 | $4,271 +7.4% | $73,560 +6.3% |
| 2015 | $3,978 -1.3% | $69,200 +0.2% |
| 2014 | $4,031 +5.7% | $69,060 +0.5% |
| 2013 | $3,815 -1.5% | $68,730 -4.3% |
| 2012 | $3,873 +17.5% | $71,820 -6.1% |
| 2011 | $3,297 -7.6% | $76,480 -11.6% |
| 2010 | $3,568 +9.4% | $86,470 -5.8% |
| 2009 | $3,262 -13.6% | $91,780 |
| 2008 | $3,775 +1.3% | $91,780 +5.9% |
| 2007 | $3,727 +18.7% | $86,660 |
| 2006 | $3,139 -10.5% | $86,660 +12% |
| 2005 | $3,506 -1% | $77,400 +7% |
| 2004 | $3,542 +31% | $72,340 +10% |
| 2003 | $2,705 -15.8% | $65,760 +11.5% |
| 2002 | $3,212 +4.2% | $58,960 +6.8% |
| 2001 | $3,084 +12.5% | $55,210 +3.5% |
| 2000 | $2,742 | $53,340 |
Find assessor info on the county website
Source: MRED as distributed by MLS GRID. This data may not be complete. We recommend contacting the local school district to confirm school assignments for this home.