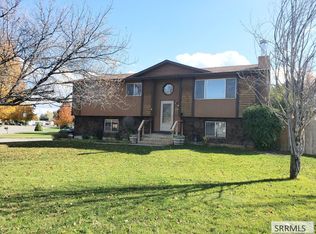
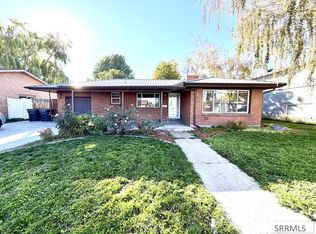
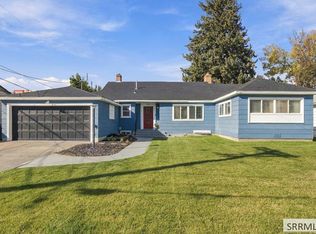
$341,100
4 bd2 ba1.8k sqft
2110 Rendezvous Rd, Idaho Falls, ID 83402
Off Market

Zillow last checked:
Listing updated:
Jorelle McClellan 208-351-7875,
Silvercreek Realty Group

$329,000
$306,000 - $352,000
$2,094/mo
| Date | Event | Price |
|---|---|---|
| 11/1/2026 | Listed for sale | $365,000+0.6%$175/sqft |
Source:  SRMLS #2190118 Report a problem | ||
| 5/17/2024 | Listing removed | -- |
Source: SRMLS #2163993 Report a problem | ||
| 4/14/2024 | Price change | $363,000-0.5%$175/sqft |
Source: SRMLS #2163993 Report a problem | ||
| 3/26/2024 | Listed for sale | $365,000$175/sqft |
Source: SRMLS #2163993 Report a problem | ||
| 12/1/2023 | Listing removed | $365,000$175/sqft |
Source: SRMLS #2154870 Report a problem | ||
| 11/17/2023 | Price change | $365,000-2.7%$175/sqft |
Source: SRMLS #2154870 Report a problem | ||
| 9/5/2023 | Price change | $375,000-2.6%$180/sqft |
Source: SRMLS #2154870 Report a problem | ||
| 8/11/2023 | Price change | $385,000-1.3%$185/sqft |
Source: SRMLS #2154870 Report a problem | ||
| 7/10/2023 | Price change | $390,000-2.5%$188/sqft |
Source: SRMLS #2154870 Report a problem | ||
| 6/9/2023 | Listed for sale | $400,000+23.1%$192/sqft |
Source: SRMLS #2154870 Report a problem | ||
| 9/9/2022 | Sold | -- |
Source: Agent Provided Report a problem | ||
| 8/15/2022 | Pending sale | $325,000$156/sqft |
Source:  PCTMLS #571172 Report a problem | ||
| 8/3/2022 | Price change | $325,000-1.5%$156/sqft |
Source: SRMLS #2146465 Report a problem | ||
| 7/7/2022 | Listed for sale | $330,000$159/sqft |
Source: SRMLS #2146465 Report a problem | ||
| 7/5/2022 | Pending sale | $330,000$159/sqft |
Source: SRMLS #2146465 Report a problem | ||
| 6/28/2022 | Listed for sale | $330,000+38.1%$159/sqft |
Source: SRMLS #2146465 Report a problem | ||
| 7/16/2020 | Sold | -- |
Source: Agent Provided Report a problem | ||
| 6/10/2020 | Listed for sale | $239,000+13.8%$115/sqft |
Source: Edge Real Estate #2129919 Report a problem | ||
| 8/9/2019 | Sold | -- |
Source: Agent Provided Report a problem | ||
| 7/11/2019 | Listed for sale | $210,000$101/sqft |
Source: Keller Williams Realty East Idaho #2123386 Report a problem | ||
| Year | Property taxes | Tax assessment |
|---|---|---|
| 2026 | $1,957 +8.4% | $361,786 +2.2% |
| 2025 | $1,806 +5.5% | $353,996 +6% |
| 2024 | $1,712 -22.2% | $333,905 -8.5% |
| 2023 | $2,199 +24.9% | $364,755 +15.9% |
| 2022 | $1,761 -36.1% | $314,580 +36.3% |
| 2021 | $2,757 +64.8% | $230,812 +15.9% |
| 2020 | $1,673 -39.3% | $199,131 +11.5% |
| 2019 | $2,757 +64.8% | $178,671 -3.9% |
| 2018 | $1,673 +25.8% | $185,968 +33.3% |
| 2017 | $1,330 +8.8% | $139,538 +6.7% |
| 2016 | $1,223 | $130,724 +7.3% |
| 2015 | $1,223 +5.7% | $121,862 |
| 2014 | $1,157 | $121,862 +3.4% |
| 2013 | -- | $117,842 -5.3% |
| 2012 | -- | $124,502 +10.3% |
| 2011 | $1,135 -0.9% | $112,882 -5.8% |
| 2010 | $1,145 -3.4% | $119,776 -12.7% |
| 2009 | $1,186 | $137,177 |
| 2007 | -- | -- |
| 2005 | $1,412 +15.1% | -- |
| 2004 | $1,227 +1% | -- |
| 2003 | $1,216 +2.4% | -- |
| 2002 | $1,187 +0.6% | -- |
| 2000 | $1,180 | -- |
Source: SRMLS. This data may not be complete. We recommend contacting the local school district to confirm school assignments for this home.


A local agent can set up tours, give advice and negotiate with sellers.
A local lender can help you make sure your offer is ready when you are.