$--
2 bd|1 ba|650 sqft
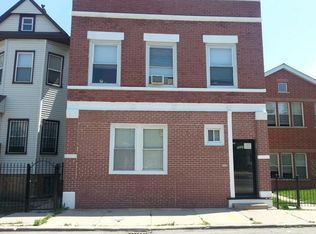
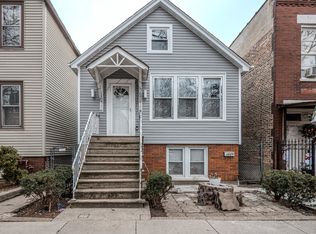
5029 S Racine Ave #2E, Chicago, IL 60609
Off Market
Zillow last checked: 7 hours ago
Listing updated: June 17, 2025 at 10:07pm
Jose Leon 708-484-2300,
RE/MAX Partners
Not available
Estimated sales range
Not available
Not available
| Date | Event | Price |
|---|---|---|
| 5/14/2025 | Price change | $384,900-3.8% |
Source: | ||
| 4/8/2025 | Price change | $399,900-4.8% |
Source: | ||
| 3/12/2025 | Listed for sale | $419,900 |
Source: | ||
| 3/11/2025 | Contingent | $419,900 |
Source: | ||
| 12/10/2024 | Listed for sale | $419,900+170.9% |
Source: | ||
| 4/11/2024 | Sold | $155,000-11.9% |
Source: Public Record Report a problem | ||
| 1/1/2024 | Listing removed | -- |
Source: | ||
| 10/31/2023 | Price change | $176,000-2.2% |
Source: | ||
| 6/22/2023 | Price change | $180,000-2.7% |
Source: | ||
| 5/4/2023 | Price change | $185,000-7% |
Source: | ||
| 4/13/2023 | Listed for sale | $199,000+11.2% |
Source: | ||
| 2/11/2023 | Listing removed | -- |
Source: | ||
| 1/26/2023 | Price change | $179,000-0.6% |
Source: | ||
| 1/11/2023 | Listed for sale | $180,000 |
Source: | ||
| 12/13/2022 | Listing removed | -- |
Source: | ||
| 12/2/2022 | Price change | $180,000-10% |
Source: | ||
| 11/12/2022 | Price change | $199,900-7% |
Source: | ||
| 11/2/2022 | Price change | $215,000-2.3% |
Source: | ||
| 10/10/2022 | Listed for sale | $220,000-13.7% |
Source: | ||
| 7/13/2022 | Listing removed | -- |
Source: | ||
| 6/10/2022 | Pending sale | $255,000 |
Source: | ||
| 5/31/2022 | Listed for sale | $255,000-10.5% |
Source: | ||
| 5/9/2022 | Listing removed | -- |
Source: | ||
| 4/21/2022 | Listed for sale | $285,000+70.7% |
Source: | ||
| 11/2/2017 | Sold | $167,000+554.9% |
Source: | ||
| 5/10/2013 | Sold | $25,500+0.8% |
Source: Public Record Report a problem | ||
| 2/21/2013 | Sold | $25,300+66.4% |
Source: | ||
| 10/13/2009 | Sold | $15,200-94% |
Source: Agent Provided Report a problem | ||
| 12/16/2004 | Sold | $255,000+15.9% |
Source: Public Record Report a problem | ||
| 4/30/2004 | Sold | $220,000 |
Source: Public Record Report a problem | ||
| Year | Property taxes | Tax assessment |
|---|---|---|
| 2023 | $2,532 +2.6% | $12,000 |
| 2022 | $2,468 +2.3% | $12,000 |
| 2021 | $2,413 +38.9% | $12,000 +53.8% |
| 2020 | $1,738 -3.5% | $7,801 -13% |
| 2019 | $1,802 +1.7% | $8,967 |
| 2018 | $1,771 -51% | $8,967 -46.6% |
| 2017 | $3,612 +7.5% | $16,778 |
| 2016 | $3,360 +9.3% | $16,778 |
| 2015 | $3,074 +43.7% | $16,778 +45.5% |
| 2014 | $2,139 +2% | $11,528 |
| 2013 | $2,097 +1.4% | $11,528 |
| 2012 | $2,069 -12.1% | $11,528 -20.6% |
| 2011 | $2,354 -0.4% | $14,528 |
| 2010 | $2,364 +4.4% | $14,528 |
| 2009 | $2,265 -34.9% | $14,528 -40.1% |
| 2008 | $3,482 +1% | $24,273 |
| 2007 | $3,447 -1.1% | $24,273 |
| 2006 | $3,485 +241.7% | $24,273 +289% |
| 2005 | $1,020 +1% | $6,240 |
| 2004 | $1,009 +2.2% | $6,240 |
| 2003 | $987 | $6,240 |
Find assessor info on the county website
Source: MRED as distributed by MLS GRID. This data may not be complete. We recommend contacting the local school district to confirm school assignments for this home.