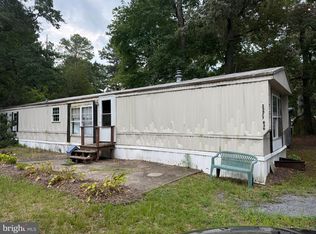
$281,800
3 bd1 ba1.1k sqft
2155 Hunting Quarter Rd, Houston, DE 19954
Off Market
Zillow last checked:
Listing updated:
Chris Carr 855-885-4663,
HomeZu (855) 885-4663

Not available
Estimated sales range
Not available
Not available
| Date | Event | Price |
|---|---|---|
| 10/6/2026 | Listed for sale | $29,900-25.1%$31/sqft |
Source:  Bright MLS #DEKT2051266 Report a problem | ||
| 10/3/2026 | Listing removed | $650$1/sqft |
Source: Zillow Rentals Report a problem | ||
| 9/30/2026 | Listed for rent | $650$1/sqft |
Source: Zillow Rentals Report a problem | ||
| 11/27/2023 | Listing removed | -- |
Source: Owner Report a problem | ||
| 10/11/2023 | Listed for sale | $39,897-33.5%$41/sqft |
Source: Owner Report a problem | ||
| 8/1/2023 | Listing removed | -- |
Source: Owner Report a problem | ||
| 6/5/2023 | Listed for sale | $59,987+9.1%$61/sqft |
Source: Owner Report a problem | ||
| 11/25/2020 | Listing removed | $55,000$56/sqft |
Source: The Moving Experience De Inc #DEKT243212 Report a problem | ||
| 10/29/2020 | Listed for sale | $55,000+400%$56/sqft |
Source: The Moving Experience De Inc #DEKT243212 Report a problem | ||
| 8/27/2020 | Sold | $11,000-55.8%$11/sqft |
Source: Public Record Report a problem | ||
| 6/18/2020 | Listed for sale | -- |
Source: Auction.com Report a problem | ||
| 9/19/2018 | Listing removed | $24,900$25/sqft |
Source: Meyer & Meyer Realty #1002684158 Report a problem | ||
| 9/7/2018 | Listed for sale | $24,900+25.1%$25/sqft |
Source: Meyer & Meyer Realty #1002684158 Report a problem | ||
| 10/25/2017 | Listing removed | $19,900$20/sqft |
Source: RIALE REALTY #722428 Report a problem | ||
| 9/13/2017 | Price change | $19,900-20.1%$20/sqft |
Source: RIALE REALTY #722428 Report a problem | ||
| 8/16/2017 | Listed for sale | $24,900-54.7%$25/sqft |
Source: RIALE REALTY #722428 Report a problem | ||
| 8/9/2017 | Sold | $55,000+67.2%$56/sqft |
Source: Public Record Report a problem | ||
| 7/21/2017 | Listed for sale | $32,900$34/sqft |
Source: RIALE REALTY #722428 Report a problem | ||
| Year | Property taxes | Tax assessment |
|---|---|---|
| 2025 | $414 | $115,000 |
| 2024 | -- | $115,000 +715.6% |
| 2023 | $332 -28.9% | $14,100 -36.5% |
| 2022 | $467 +5.8% | $22,200 |
| 2021 | $441 -4.2% | $22,200 |
| 2020 | $460 -0.1% | $22,200 |
| 2019 | $461 +1.1% | $22,200 |
| 2018 | $456 | $22,200 |
| 2017 | $456 -67.6% | $22,200 |
| 2016 | $1,407 +60.3% | $22,200 |
| 2015 | $878 +101.4% | $22,200 |
| 2014 | $436 | $22,200 |
| 2012 | -- | $22,200 |
| 2011 | -- | $22,200 |
| 2010 | -- | $22,200 |
| 2009 | -- | $22,200 |
| 2008 | -- | $22,200 |
| 2007 | -- | $22,200 +155.2% |
| 2005 | -- | $8,700 |
| 2004 | -- | $8,700 |
Source: Bright MLS. This data may not be complete. We recommend contacting the local school district to confirm school assignments for this home.