$134,400
2 bd|1 ba|935 sqft
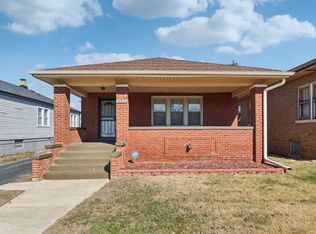
210 Ruth St, Calumet City, IL 60409
Off Market
Zillow last checked: 7 hours ago
Listing updated: March 16, 2026 at 07:26pm
Daniel Nierman 847-601-9359,
4 Sale Realty Advantage LLC
Not available
Estimated sales range
Not available
Not available
| Date | Event | Price |
|---|---|---|
| 3/17/2026 | Contingent | $209,000$160/sqft |
Source: | ||
| 3/14/2026 | Price change | $209,000-5%$160/sqft |
Source: | ||
| 3/1/2026 | Listed for sale | $219,900+126.7%$169/sqft |
Source: | ||
| 8/12/2017 | Listing removed | $97,000$74/sqft |
Source: Gateway Realty ALL PRO #09585187 Report a problem | ||
| 6/13/2017 | Listed for sale | $97,000-2%$74/sqft |
Source: Gateway Realty ALL PRO #09585187 Report a problem | ||
| 3/22/2017 | Listing removed | $98,950$76/sqft |
Source: Smith & Partners Realty Group #09564398 Report a problem | ||
| 3/14/2017 | Listed for sale | $98,950-9.2%$76/sqft |
Source: Smith & Partners Realty Group #09564398 Report a problem | ||
| 4/1/2016 | Listing removed | $109,000$84/sqft |
Source: CENTURY 21 Affiliated #09147265 Report a problem | ||
| 3/25/2016 | Price change | $109,000-8.4%$84/sqft |
Source: CENTURY 21 Affiliated #09147265 Report a problem | ||
| 2/26/2016 | Listed for sale | $119,000+417.4%$91/sqft |
Source: CENTURY 21 Affiliated #09147265 Report a problem | ||
| 11/23/2015 | Sold | $23,000-20.4%$18/sqft |
Source: Public Record Report a problem | ||
| 5/15/2014 | Sold | $28,900-3.3%$22/sqft |
Source: | ||
| 4/11/2014 | Price change | $29,900-6.3%$23/sqft |
Source: Homepath #08535232 Report a problem | ||
| 3/14/2014 | Price change | $31,900-5.1%$24/sqft |
Source: Homepath #08535232 Report a problem | ||
| 2/13/2014 | Listed for sale | $33,600+34.4%$26/sqft |
Source: Betts Realty Group, PC #08535232 Report a problem | ||
| 12/6/2013 | Listing removed | $25,000$19/sqft |
Source: ParkVue Realty Corporation #08429200 Report a problem | ||
| 8/25/2013 | Listed for sale | $25,000-82.1%$19/sqft |
Source: ParkVue Realty Corporation #08429200 Report a problem | ||
| 8/11/2008 | Sold | $140,000+109%$107/sqft |
Source: Public Record Report a problem | ||
| 2/10/2005 | Sold | $67,000-21.2%$51/sqft |
Source: Public Record Report a problem | ||
| 4/26/2002 | Sold | $85,000$65/sqft |
Source: Public Record Report a problem | ||
| Year | Property taxes | Tax assessment |
|---|---|---|
| 2023 | $6,084 +16.4% | $11,000 +52.4% |
| 2022 | $5,225 -2% | $7,217 |
| 2021 | $5,331 +7.2% | $7,217 |
| 2020 | $4,972 -22.4% | $7,217 -18.6% |
| 2019 | $6,407 +1.5% | $8,861 |
| 2018 | $6,314 +3.8% | $8,861 |
| 2017 | $6,084 +8.3% | $8,861 +2% |
| 2016 | $5,615 +3.6% | $8,684 |
| 2015 | $5,420 +0.1% | $8,684 |
| 2014 | $5,416 -0.8% | $8,684 -9.9% |
| 2013 | $5,460 +5.4% | $9,640 |
| 2012 | $5,178 +8.6% | $9,640 |
| 2011 | $4,769 -1.4% | $9,640 -16.7% |
| 2010 | $4,837 +4.9% | $11,572 |
| 2009 | $4,612 +13% | $11,572 -5% |
| 2008 | $4,081 -22.1% | $12,180 -21.5% |
| 2007 | $5,239 +6.9% | $15,524 |
| 2006 | $4,903 +0.9% | $15,524 |
| 2005 | $4,862 +63.5% | $15,524 +69.5% |
| 2004 | $2,974 +3.3% | $9,159 |
| 2003 | $2,879 +7.1% | $9,159 |
| 2002 | $2,688 +9.7% | $9,159 +11.7% |
| 2001 | $2,452 +3.4% | $8,203 |
| 2000 | $2,371 +7.2% | $8,203 |
| 1999 | $2,212 | $8,203 |
Source: MRED as distributed by MLS GRID. This data may not be complete. We recommend contacting the local school district to confirm school assignments for this home.