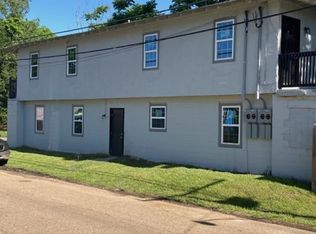
THIS IS A MUST SEE!!! Seller spared no expense in refurbishing this property. Updated flooring for low maintenance. Fresh paint colors, updated bathrooms with new vanities, new tub surrounds and bathtubs, new kitchen cabinets on one side and refreshed the original kitchen cabinets on the other side. Installed new electrical wiring, 3 mini-split ac units per side that are remote control operated. These units provide both heat and air to cover all the seasons. This could be a great opportunity for someone looking to be an OWNER/OCCUPANT live on one side and utilize the income from the other side to help cover cost. DO NOT DISTURB TENANTS. MAKE OFFERS SUBJECT TO INSPECTION. VIEWINGS TO BE SCHEDULED WITH AN ACCEPTED OFFER. Unit currently getting $1050 rent on occupied side. Also there's a NEW ROOF.
For sale
Price cut: $25.3K (8/24)
$199,750
2129 Virginia St, Baton Rouge, LA 70802
--beds
0baths
--sqft
Duplex
Built in 1986
-- sqft lot
$-- Zestimate®
$--/sqft
$-- HOA
What's special
Fresh paint colorsNew roofNew electrical wiring
- 105 days
- 106
- 6
Zillow last checked:
Listing updated:
Listed by:
Dana Littles,
Dana Littles 225-241-0958
Source: ROAM MLS,MLS#: 2026013281
Facts & features
Interior
Bedrooms & bathrooms
- Bathrooms: 0
Heating
- Wall Furnace
Cooling
- Ceiling Fan(s), Wall Unit(s)
Features
- Flooring: Tile, Vinyl
Property
Parking
- Total spaces: 2
Features
- Fencing: Chain Link
Lot
- Size: 3,920 Square Feet
- Dimensions: 40 x 100
Details
- Parcel number: 744654
Construction
Type & style
- Home type: MultiFamily
- Property subtype: Duplex
Materials
- Aluminum Siding, Brick
- Foundation: Pillar/Post/Pier, Slab
Condition
- Year built: 1986
Utilities & green energy
- Sewer: Public Sewer
- Water: Public
Community & HOA
Community
- Security: Smoke Detector(s)
- Subdivision: South Baton Rouge
HOA
- Has HOA: No
Location
- Region: Baton Rouge
Financial & listing details
- Tax assessed value: $55,100
- Annual tax amount: $676
- Date on market: 7/21/2026
Estimated market value
Not available
Estimated sales range
Not available
Not available
Price history
| Date | Event | Price |
|---|---|---|
| 8/24/2026 | Price change | $199,750-11.2% |
Source:  ROAM MLS #2026013281 Report a problem | ||
| 7/21/2026 | Listed for sale | $225,000+200% |
Source: ROAM MLS #2026013281 Report a problem | ||
| 12/24/2025 | Listing removed | $1,050 |
Source: Zillow Rentals Report a problem | ||
| 12/3/2025 | Listed for rent | $1,050 |
Source: Zillow Rentals Report a problem | ||
| 5/20/2025 | Listing removed | $1,050 |
Source: Zillow Rentals Report a problem | ||
| 5/6/2025 | Listed for rent | $1,050 |
Source: Zillow Rentals Report a problem | ||
| 4/24/2025 | Listing removed | $1,050 |
Source: Zillow Rentals Report a problem | ||
| 3/12/2025 | Listed for rent | $1,050 |
Source: Zillow Rentals Report a problem | ||
| 10/12/2024 | Listing removed | $1,050 |
Source: Zillow Rentals Report a problem | ||
| 9/28/2024 | Listed for rent | $1,050 |
Source: Zillow Rentals Report a problem | ||
| 9/13/2024 | Listing removed | $1,050 |
Source: Zillow Rentals Report a problem | ||
| 8/26/2024 | Listed for rent | $1,050 |
Source: Zillow Rentals Report a problem | ||
| 8/15/2024 | Listing removed | -- |
Source: Zillow Rentals Report a problem | ||
| 7/30/2024 | Price change | $1,050-12.5% |
Source: Zillow Rentals Report a problem | ||
| 7/26/2024 | Listed for rent | $1,200 |
Source: Zillow Rentals Report a problem | ||
| 5/12/2023 | Sold | -- |
Source: ROAM MLS #2023004735 Report a problem | ||
| 5/9/2023 | Pending sale | $75,000 |
Source: ROAM MLS #2023004735 Report a problem | ||
| 4/30/2023 | Listing removed | -- |
Source: ROAM MLS #2023004735 Report a problem | ||
| 4/7/2023 | Price change | $75,000-6.3% |
Source: ROAM MLS #2023004735 Report a problem | ||
| 3/28/2023 | Listed for sale | $80,000+45.5% |
Source: ROAM MLS #2023004735 Report a problem | ||
| 9/9/2019 | Sold | -- |
Source: Public Record Report a problem | ||
| 8/12/2019 | Listed for sale | $55,000 |
Source: eXp Realty #2019014078 Report a problem | ||
Public tax history
| Year | Property taxes | Tax assessment |
|---|---|---|
| 2025 | $676 +4.7% | $5,510 |
| 2024 | $645 +32.8% | $5,510 +35% |
| 2023 | $486 -0.2% | $4,080 |
| 2022 | $487 +2.4% | $4,080 |
| 2021 | $476 +0.2% | $4,080 |
| 2020 | $475 +130.7% | $4,080 +140% |
| 2019 | $206 +1.3% | $1,700 |
| 2018 | $203 +827.2% | $1,700 |
| 2017 | $22 | $1,700 |
| 2016 | $22 | $1,700 +3% |
| 2015 | $22 +1.3% | $1,650 |
| 2014 | $22 | $1,650 |
| 2013 | $22 -88.7% | $1,650 |
| 2012 | $192 +8.7% | $1,650 |
| 2011 | $176 +0.1% | $1,650 |
| 2010 | $176 +696.7% | $1,650 |
| 2009 | $22 | $1,650 |
| 2008 | $22 +3.2% | $1,650 +6.5% |
| 2007 | $21 +0% | $1,550 |
| 2006 | $21 0% | $1,550 |
| 2005 | $21 +0% | $1,550 |
| 2004 | $21 -0.3% | $1,550 +3.3% |
| 2003 | $22 | $1,500 |
| 2002 | $22 0% | $1,500 |
| 2001 | $22 +72% | $1,500 |
| 2000 | $13 | $1,500 |
Find assessor info on the county website
Monthly payment
Est. payment
Payment breakdown
Explore the cost of this home by adjusting the details. Changes won't be saved.Climate risks
Neighborhood: Old South Baton Rouge

Similar homes
- $--3 bd2 ba1.2k sqft1414 N 25th St, Baton Rouge, LA 70802Auction
 Auction.com 2
- $225,000-- bd-- ba-- sqft2389 Tennessee St, Baton Rouge, LA 70802For Sale
 MLS ID #2026006900, Timothy Houk, Keller Williams Realty Red Stick Partners. ROAM MLS
- $199,9002 bd3 ba1.2k sqft2210 Christian St APT 29, Baton Rouge, LA 70808For Sale
 MLS ID #2576905, Jennifer L Griffith, Realty One Group Immobilia. ROAM MLS
- $185,0002 bd1 ba990 sqft740 France St, Baton Rouge, LA 70802For Sale
 MLS ID #200HMK, Stephen Couvillion, Keller Williams Realty-First Choice. ROAM MLS
- $215,0003 bd2 ba1.4k sqft4464 Highland Rd APT 705, Baton Rouge, LA 70808For SaleMLS ID #200JPI, Madeline Landry Thompson, Exit Realty Group. ROAM MLS
- $218,0003 bd2 ba1.5k sqft535 W McKinley St, Baton Rouge, LA 70802For SaleMLS ID #2026013129, Ruba Thomas-Anderson, Ruba Thomas REALTOR. ROAM MLS
- $180,0004 bd3 ba2k sqft1436 N 28th St, Baton Rouge, LA 70802For SaleMLS ID #2026017295, Dianne Adams, RE/MAX Professional. ROAM MLS
- $180,0004 bd2 ba3k sqft1851 Plank Rd, Baton Rouge, LA 70802For SaleMLS ID #2026007459, Amber Thornton, Blue Heron Realty. ROAM MLS
- $210,0002 bd2 ba1.2k sqft730 S 18th St, Baton Rouge, LA 70802For SaleMLS ID #2026011377, Kisha Hayes, Innerspace Properties, LLC. ROAM MLS
- $220,0003 bd2 ba1.3k sqft830 East Blvd, Baton Rouge, LA 70802For SaleMLS ID #2024011391, Debra Fortune, Realty Plus LLC. ROAM MLS
- $199,000-- bd-- ba-- sqft1257 Jim Taylor Dr, Baton Rouge, LA 70820For SaleMLS ID #2026018524, David Vercher, KW Commercial Baton Rouge. ROAM MLS
- $145,0003 bd2 ba1.5k sqft2244 Georgia St, Baton Rouge, LA 70802For SaleMLS ID #2026013937, Jillian Wright, Wright & Company LLC. ROAM MLS
- $160,0003 bd2 ba1.7k sqft2540 Vermont St, Baton Rouge, LA 70802For SaleMLS ID #2026015541, Phonicia Palmer, Keller Williams Realty Red Stick Partners. ROAM MLS
- $200,0003 bd2 ba1.2k sqft1345 Harwich Dr, Baton Rouge, LA 70820For SaleMLS ID #2026014631, Amber Butler, United Properties of Louisiana. ROAM MLS
- $209,0002 bd2 ba1.8k sqft1670 North St, Baton Rouge, LA 70802For SaleMLS ID #2026016931, Lance Daggs, Reve REALTORS. ROAM MLS
- $219,9002 bd2 ba1.4k sqft750 S 18th St, Baton Rouge, LA 70802For SaleMLS ID #2026009018, Robin Gaspard, Gaspard & Co Real Estate LLC. ROAM MLS
- $223,0003 bd2 ba1.1k sqft1425 Lorri Burgess Ave, Baton Rouge, LA 70802For SaleMLS ID #2026017868, Carlene Rentz, Keller Williams Realty-First Choice. ROAM MLS
- $185,0002 bd2 ba1.2k sqft141 E Boyd Dr APT 308, Baton Rouge, LA 70808For SaleMLS ID #2026015046, Derrick Acosta, Century 21 Action Realty. ROAM MLS
