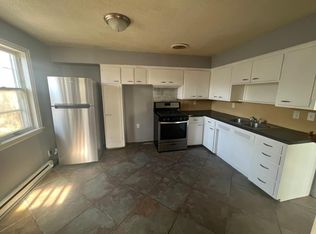
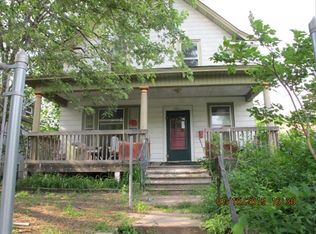
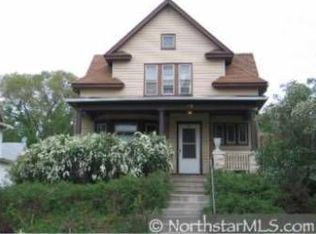
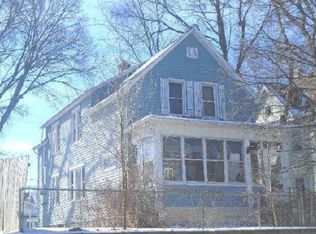
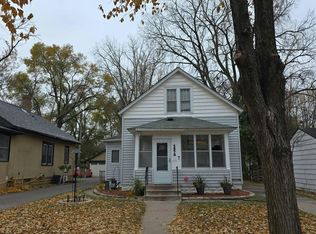
This 2672 square foot multi family home has 5 bedrooms and 2.0 bathrooms. This home is located at 703 Case Ave, Saint Paul, MN 55106.
Pre-foreclosure
Est. $241,200
703 Case Ave, Saint Paul, MN 55106
5beds
2,672sqft
MultiFamily
Built in 1905
-- sqft lot
$-- Zestimate®
$90/sqft
$-- HOA
Overview
- 179 days |
- 198 |
- 15 |
Facts & features
Interior
Bedrooms & bathrooms
- Bedrooms: 5
- Bathrooms: 2
- Full bathrooms: 2
Heating
- Forced air, Other
Cooling
- Central
Features
- Basement: Full
- Has fireplace: Yes
Interior area
- Total interior livable area: 2,672 sqft
Property
Parking
- Parking features: Garage - Detached
Features
- Exterior features: Vinyl
Lot
- Size: 7,405 Square Feet
Details
- Parcel number: 292922140139
- Zoning: Residential-Multi-Family
Construction
Type & style
- Home type: MultiFamily
Materials
- Roof: Asphalt
Condition
- Year built: 1905
Utilities & green energy
- Sewer: City Sewer/Connected
Community & HOA
Location
- Region: Saint Paul
Financial & listing details
- Price per square foot: $90/sqft
- Tax assessed value: $241,200
- Annual tax amount: $13,376
Visit our professional directory to find a foreclosure specialist in your area that can help with your home search.
Find a foreclosure agentForeclosure details
Estimated market value
Not available
Estimated sales range
Not available
$1,673/mo
Price history
Price history
| Date | Event | Price |
|---|---|---|
| 11/15/2019 | Sold | $212,500-5.6%$80/sqft |
Source: | ||
| 11/12/2019 | Pending sale | $225,000$84/sqft |
Source: Kris Lindahl Real Estate #5274828 Report a problem | ||
| 10/25/2019 | Listed for sale | $225,000$84/sqft |
Source: Kris Lindahl Real Estate #5274828 Report a problem | ||
| 10/25/2019 | Pending sale | $225,000$84/sqft |
Source: Kris Lindahl Real Estate #5274828 Report a problem | ||
| 10/3/2019 | Price change | $225,000-6.3%$84/sqft |
Source: Kris Lindahl Real Estate #5274828 Report a problem | ||
| 9/20/2019 | Listed for sale | $240,000+413.1%$90/sqft |
Source: Kris Lindahl Real Estate #5274828 Report a problem | ||
| 3/18/2009 | Sold | $46,770-15%$18/sqft |
Source: | ||
| 11/30/2008 | Listing removed | $55,000$21/sqft |
Source: Keller Williams Realty #3591117 Report a problem | ||
| 10/3/2008 | Price change | $55,000-15.4%$21/sqft |
Source: Keller Williams Realty #3591117 Report a problem | ||
| 9/25/2008 | Price change | $65,000-13.3%$24/sqft |
Source: Keller Williams Realty #3591117 Report a problem | ||
| 9/20/2008 | Price change | $75,000-16.6%$28/sqft |
Source: Keller Williams Realty #3591117 Report a problem | ||
| 9/11/2008 | Price change | $89,900-10%$34/sqft |
Source: Keller Williams Realty #3591117 Report a problem | ||
| 9/6/2008 | Listed for sale | $99,900-42.9%$37/sqft |
Source: Keller Williams Realty #3591117 Report a problem | ||
| 5/6/2002 | Sold | $175,000+218.2%$65/sqft |
Source: Public Record Report a problem | ||
| 11/28/2000 | Sold | $55,000$21/sqft |
Source: Public Record Report a problem | ||
Public tax history
Public tax history
| Year | Property taxes | Tax assessment |
|---|---|---|
| 2025 | $13,376 +66.9% | $241,200 -2.1% |
| 2024 | $8,014 -18.3% | $246,300 +6.4% |
| 2023 | $9,808 -10.1% | $231,400 -0.5% |
| 2022 | $10,904 +135.7% | $232,500 +15.9% |
| 2021 | $4,626 +60.5% | $200,600 +2.9% |
| 2020 | $2,882 +26% | $195,000 +48.7% |
| 2019 | $2,288 | $131,100 |
| 2018 | $2,288 -6.7% | $131,100 +15% |
| 2017 | $2,454 | $114,000 |
| 2016 | $2,454 -18.5% | -- |
| 2015 | $3,010 +44.3% | $90,000 |
| 2014 | $2,086 -25.6% | -- |
| 2013 | $2,802 -3.3% | -- |
| 2012 | $2,898 +22.2% | -- |
| 2011 | $2,372 | -- |
| 2010 | -- | -- |
| 2009 | $3,410 +22.1% | -- |
| 2008 | $2,792 +12.9% | -- |
| 2007 | $2,472 +15.8% | -- |
| 2006 | $2,134 +24.8% | -- |
| 2005 | $1,710 +12.4% | -- |
| 2004 | $1,522 +0.5% | -- |
| 2003 | $1,514 -6.4% | -- |
| 2002 | $1,618 -8.5% | -- |
| 2001 | $1,768 +18.1% | -- |
| 2000 | $1,497 | -- |
Find assessor info on the county website
Monthly payment
Estimated monthly payment
All calculations are estimates and provided by Zillow, Inc. for informational purposes only. Actual amounts may vary.
HOA fees may include property taxes on listings classified as Co-Ops. Contact the listing agent and/or owner for fee details.
Mortgage interest rates are dependent on a number of factors, including credit score, down payment, and repayment length. Interest rate data provided by Zillow Group Marketplace, Inc. as of 1/1/1970 from various mortgage lenders with which we have lead or other similar arrangements; the Estimated Payment is an average of those rates.
See how much you could borrow to make a competitive offer.
Climate risks
Neighborhood: Payne Phalen
Nearby schools
GreatSchools rating
- NAJohn A.Johnson Achievement Plus Elementary SchoolGrades: PK-5Distance: 0.2 mi
- 2/10Washington Tech Secondary MagnetGrades: 6-12Distance: 2.3 mi


Nearby cities
Nearby neighborhoods
Nearby zip codes
Other Saint Paul Topics
