Mark your calendar! This property will be sold at a live foreclosure auction in COOK county, Illinois on 05-18-2026 at 10:30 AM. Register for free on Hubzu to receive important updates and reminders about this auction. Hubzu's leading online home auction marketing platform has helped thousands of people buy and sell over 221,000 properties across the nation. Find your next investment with us! This will be a value-based foreclosure auction, which means the beneficiary has provided a bid based on market value. This is a great opportunity for buyers since the final reserve may be priced at or below current market value. *NOTE: This sale will not be conducted by Hubzu/Altisource. The information provided here is for marketing purposes only.* "As is" cash only sale with no contingencies or inspections. Buyer will be responsible for obtaining possession of the property upon closing.
Pending
Price Unknown
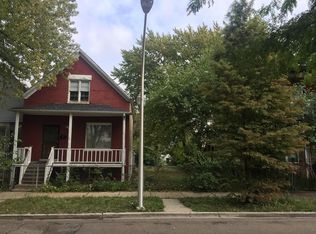
449 N Harding Ave, Chicago, IL 60624
4beds
3baths
1,679sqft
Townhouse
Built in 1883
-- sqft lot
$-- Zestimate®
$--/sqft
$-- HOA
What's special
- 10 days |
- 4 |
- 0 |
Zillow last checked:
Source: Hubzu REO,MLS#: 92917441052
Facts & features
Interior
Bedrooms & bathrooms
- Bedrooms: 4
- Bathrooms: 3
Features
- Has basement: No
Interior area
- Total structure area: 1,679
- Total interior livable area: 1,679 sqft
Property
Details
- Parcel number: 1611127049
Construction
Type & style
- Home type: Townhouse
- Property subtype: Townhouse
Condition
- Year built: 1883
Community & HOA
Location
- Region: Chicago
Financial & listing details
- Tax assessed value: $74,990
- Annual tax amount: $169
- Date on market: 5/1/2026
- Lease term: Contact For Details
This listing is brought to you by Hubzu REO
View Auction DetailsEstimated market value
Not available
Estimated sales range
Not available
$2,840/mo
Price history
| Date | Event | Price |
|---|---|---|
| 5/1/2026 | Pending sale | -- |
Source: | ||
| 6/11/2025 | Listing removed | $250,000$149/sqft |
Source: | ||
| 6/4/2025 | Price change | $250,000-15.3%$149/sqft |
Source: | ||
| 4/18/2025 | Listed for sale | $295,000+14650%$176/sqft |
Source: | ||
| 3/24/2021 | Listing removed | -- |
Source: Owner Report a problem | ||
| 8/19/2011 | Sold | $2,000-89.5%$1/sqft |
Source: Public Record Report a problem | ||
| 3/24/2011 | Listing removed | $19,100$11/sqft |
Source: Owner Report a problem | ||
| 11/3/2009 | Price change | $19,100-23.6%$11/sqft |
Source: Owner Report a problem | ||
| 10/21/2009 | Listed for sale | $25,000+108.3%$15/sqft |
Source: Owner Report a problem | ||
| 2/10/2009 | Sold | $12,000-97.4%$7/sqft |
Source: | ||
| 4/14/2004 | Sold | $470,000+452.9%$280/sqft |
Source: Public Record Report a problem | ||
| 7/13/2000 | Sold | $85,000+347.4%$51/sqft |
Source: Public Record Report a problem | ||
| 5/1/2000 | Sold | $19,000$11/sqft |
Source: Public Record Report a problem | ||
Public tax history
| Year | Property taxes | Tax assessment |
|---|---|---|
| 2023 | -- | -- |
| 2022 | -- | -- |
| 2021 | $169 -65.9% | $7,499 -11% |
| 2020 | $494 -12.9% | $8,422 -13% |
| 2019 | $567 -70.3% | $9,681 |
| 2018 | $1,912 +69.9% | $9,681 -47.8% |
| 2017 | $1,125 -26.7% | $18,561 |
| 2016 | $1,535 +4% | $18,561 |
| 2015 | $1,476 +0.9% | $18,561 +51% |
| 2014 | $1,463 -47.6% | $12,288 -20% |
| 2013 | $2,792 +1.4% | $15,351 |
| 2012 | $2,755 -8.6% | $15,351 -17.5% |
| 2011 | $3,014 -0.4% | $18,599 |
| 2010 | $3,027 +4.4% | $18,599 |
| 2009 | $2,900 -46.3% | $18,599 -50.6% |
| 2008 | $5,398 +1% | $37,633 |
| 2007 | $5,345 -1.1% | $37,633 |
| 2006 | $5,402 +152.1% | $37,633 +186.9% |
| 2005 | $2,143 +1% | $13,116 |
| 2004 | $2,122 +2.2% | $13,116 |
| 2003 | $2,075 +38.4% | $13,116 +57.2% |
| 2002 | $1,499 +3.8% | $8,344 |
| 2001 | $1,445 +61% | $8,344 |
| 2000 | $897 +78% | $8,344 +78.6% |
| 1999 | $504 | $4,671 |
Find assessor info on the county website
Climate risks
Neighborhood: East Garfield Park
Nearby schools
GreatSchools rating
- 3/10Ward L Elementary SchoolGrades: PK-8Distance: 0.4 mi
- 1/10Orr Academy High SchoolGrades: 9-12Distance: 0.3 mi
- Illinois
- Cook County
- Chicago
- 60624
- East Garfield Park
- 449 N Harding Ave
Nearby cities
Nearby neighborhoods
Nearby zip codes
Other Chicago Topics
