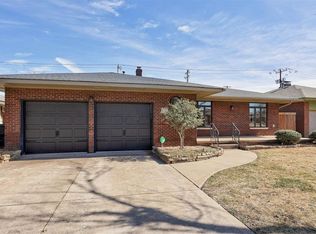
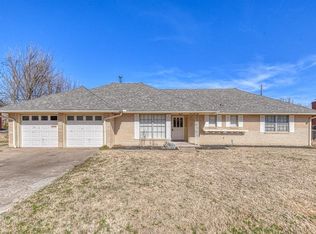
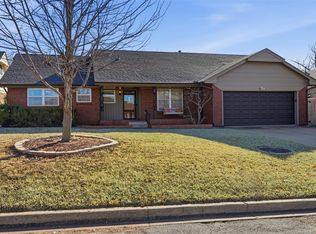
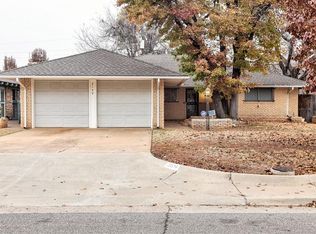
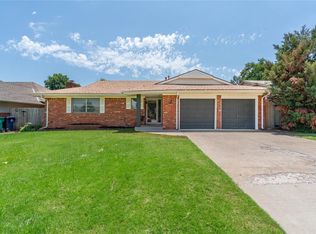
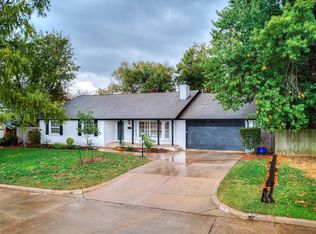
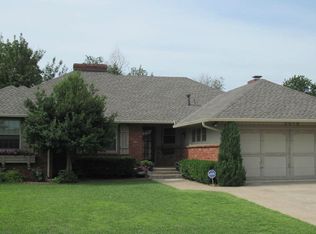
This charming 3-bedroom, 2-bathroom is just steps from the new Oak Development. The location alone makes this home a standout. Featuring a large backyard with plenty of space to hang out, play, and entertain, plus two comfortable living areas inside and great storage throughout. With all the momentum happening at Oak, this is a prime opportunity to get in right next to the action. Don’t miss it!
For sale
Price cut: $5K (1/8)
$290,000
2530 NW 51st St, Oklahoma City, OK 73112
3beds
1,913sqft
Est.:
Single Family Residence
Built in 1959
9,112.75 Square Feet Lot
$280,900 Zestimate®
$152/sqft
$-- HOA
What's special
Great storage throughout
- 64 days |
- 1,005 |
- 48 |
Zillow last checked: 7 hours ago
Listing updated: January 08, 2026 at 07:02pm
Listed by:
Andrew Lee Green 405-408-1311,
Nichols Hills Properties LLC
Source: MLSOK/OKCMAR as distributed by MLS GRID,MLS#: 1208572
Tour with a local agent
Facts & features
Interior
Bedrooms & bathrooms
- Bedrooms: 3
- Bathrooms: 2
- Full bathrooms: 2
Heating
- Central
Cooling
- Has cooling: Yes
Features
- Number of fireplaces: 1
- Fireplace features: None
Interior area
- Total structure area: 1,913
- Total interior livable area: 1,913 sqft
Property
Parking
- Total spaces: 2
- Parking features: Garage
- Garage spaces: 2
Features
- Levels: One
- Stories: 1
- Patio & porch: Porch, Patio
Lot
- Size: 9,112.75 Square Feet
- Features: Interior Lot
Details
- Parcel number: 2530NW51st73112
- Special conditions: None
Construction
Type & style
- Home type: SingleFamily
- Architectural style: Ranch
- Property subtype: Single Family Residence
Materials
- Brick & Frame
- Foundation: Slab
- Roof: Composition
Condition
- Year built: 1959
Community & HOA
Location
- Region: Oklahoma City
Financial & listing details
- Price per square foot: $152/sqft
- Tax assessed value: $270,027
- Annual tax amount: $3,474
- Date on market: 1/8/2026
Estimated market value
$280,900
$267,000 - $295,000
$1,833/mo
Price history
Price history
| Date | Event | Price |
|---|---|---|
| 1/8/2026 | Price change | $290,000-1.7%$152/sqft |
Source: | ||
| 10/24/2025 | Price change | $295,000-1.3%$154/sqft |
Source: | ||
| 6/20/2025 | Price change | $299,000-2%$156/sqft |
Source: | ||
| 1/30/2025 | Price change | $305,000-3.2%$159/sqft |
Source: | ||
| 11/15/2024 | Price change | $315,000-3.1%$165/sqft |
Source: | ||
| 8/8/2024 | Listed for sale | $325,000+30%$170/sqft |
Source: | ||
| 5/26/2023 | Listing removed | -- |
Source: Zillow Rentals Report a problem | ||
| 5/5/2023 | Listed for rent | $2,000$1/sqft |
Source: Zillow Rentals Report a problem | ||
| 4/25/2023 | Listing removed | -- |
Source: Zillow Rentals Report a problem | ||
| 4/4/2023 | Listed for rent | $2,000$1/sqft |
Source: Zillow Rentals Report a problem | ||
| 3/23/2023 | Listing removed | -- |
Source: Zillow Rentals Report a problem | ||
| 2/9/2023 | Price change | $2,000-9.1%$1/sqft |
Source: Zillow Rentals Report a problem | ||
| 1/30/2023 | Listed for rent | $2,200$1/sqft |
Source: Zillow Rentals Report a problem | ||
| 1/5/2023 | Listing removed | -- |
Source: Zillow Rentals Report a problem | ||
| 12/8/2022 | Listed for rent | $2,200+46.7%$1/sqft |
Source: Zillow Rentals Report a problem | ||
| 3/24/2021 | Listing removed | -- |
Source: Owner Report a problem | ||
| 11/9/2020 | Listing removed | $1,500$1/sqft |
Source: Owner Report a problem | ||
| 9/20/2020 | Listed for rent | $1,500$1/sqft |
Source: Owner Report a problem | ||
| 6/18/2019 | Listing removed | $1,500$1/sqft |
Source: Owner Report a problem | ||
| 6/12/2019 | Listed for rent | $1,500$1/sqft |
Source: Owner Report a problem | ||
| 2/25/2019 | Listing removed | $1,500$1/sqft |
Source: Owner Report a problem | ||
| 1/25/2019 | Listed for rent | $1,500$1/sqft |
Source: Owner Report a problem | ||
| 8/5/2017 | Listing removed | $1,500$1/sqft |
Source: Owner Report a problem | ||
| 7/8/2017 | Price change | $1,500-6.3%$1/sqft |
Source: Owner Report a problem | ||
| 6/13/2017 | Listed for rent | $1,600$1/sqft |
Source: Owner Report a problem | ||
| 3/16/2017 | Sold | $250,000+38.9%$131/sqft |
Source: Public Record Report a problem | ||
| 10/4/2012 | Sold | $180,000+2.3%$94/sqft |
Source: | ||
| 1/27/2009 | Sold | $176,000$92/sqft |
Source: | ||
| 9/27/2008 | Sold | $176,000+64.5%$92/sqft |
Source: Agent Provided Report a problem | ||
| 6/16/2008 | Sold | $107,000$56/sqft |
Source: Public Record Report a problem | ||
Public tax history
Public tax history
| Year | Property taxes | Tax assessment |
|---|---|---|
| 2024 | $3,680 +5.9% | $29,702 +5% |
| 2023 | $3,474 +9.6% | $28,288 +5% |
| 2022 | $3,169 +4.9% | $26,939 +5% |
| 2021 | $3,020 +3.8% | $25,657 +5% |
| 2020 | $2,910 +33.3% | $24,436 +5% |
| 2019 | $2,183 +5% | $23,273 +5% |
| 2018 | $2,080 -15.7% | $22,165 +1.8% |
| 2017 | $2,468 | $21,771 +5% |
| 2016 | $2,468 +4.9% | $20,734 +3.5% |
| 2015 | $2,352 +5.4% | $20,038 +2.2% |
| 2014 | $2,231 | $19,601 +0.3% |
| 2013 | -- | $19,546 +1% |
| 2012 | -- | $19,345 |
| 2011 | -- | $19,345 |
| 2010 | -- | $19,345 +23% |
| 2009 | -- | $15,722 +78.1% |
| 2008 | -- | $8,829 +5% |
| 2007 | -- | $8,408 |
| 2006 | -- | $8,408 0% |
| 2005 | -- | $8,409 -89% |
| 2004 | $711 | $76,450 +809.1% |
| 2003 | -- | $8,409 -23% |
| 2002 | -- | $10,922 -4% |
| 2001 | -- | $11,378 +2.1% |
| 2000 | -- | $11,144 +0% |
| 1999 | -- | $11,140 |
Find assessor info on the county website
BuyAbility℠ payment
Est. payment
$1,638/mo
Principal & interest
$1387
Property taxes
$251
More affordability tools
Climate risks
Neighborhood: Belle Isle
Nearby schools
GreatSchools rating
- 2/10Monroe Elementary SchoolGrades: PK-4Distance: 0.2 mi
- 2/10John Marshall Middle SchoolGrades: 5-8Distance: 5 mi
- 1/10John Marshall High SchoolGrades: 9-12Distance: 5 mi
Schools provided by the listing agent
- Elementary: Monroe ES
- Middle: John Marshall MS
- High: John Marshall HS
Source: MLSOK/OKCMAR as distributed by MLS GRID. This data may not be complete. We recommend contacting the local school district to confirm school assignments for this home.
Local experts in 73112