Perfect for buyers seeking a value-added opportunity, this spacious 3-bedroom, 2-bath home offers plenty of potential in a well-established neighborhood. The large living room features a fireplace, creating a warm and inviting focal point for gatherings and entertaining. The kitchen includes a center island, ample workspace, and abundant storage. The primary suite offers an en suite bath with a walk-in shower, while additional highlights include a 2-car attached garage, and a large covered front porch. With solid features, generous living space, and room to make it your own, this property is full of possibilities. Schedule your private showing today. Buyer to verify all information. This property may qualify for Seller Financing (Vendee).
Foreclosure
$118,000
1152 NE 59th St, Oklahoma City, OK 73111
3beds
1,820sqft
Single Family Residence
Built in 1959
0.28 Acres Lot
$217,400 Zestimate®
$65/sqft
$-- HOA
What's special
- 1 day
- 387
- 73
Likely to sell faster than
Zillow last checked:
Listing updated:
Listed by:
Pat Slack 405-476-7653,
RE/MAX Pros
Source: MLSOK/OKCMAR as distributed by MLS GRID,MLS#: 1253472
Facts & features
Interior
Bedrooms & bathrooms
- Bedrooms: 3
- Bathrooms: 2
- Full bathrooms: 2
Heating
- Central
Cooling
- Has cooling: Yes
Features
- Number of fireplaces: 1
- Fireplace features: Masonry
Interior area
- Total structure area: 1,820
- Total interior livable area: 1,820 sqft
Property
Parking
- Total spaces: 2
- Parking features: Garage
- Garage spaces: 2
Features
- Levels: One
- Stories: 1
Lot
- Size: 0.28 Acres
- Features: Interior Lot
Details
- Parcel number: 1152NE59th73111
- Special conditions: Corporate Approval,Real Estate Owned
Construction
Type & style
- Home type: SingleFamily
- Architectural style: Traditional
- Property subtype: Single Family Residence
Materials
- Brick & Frame
- Foundation: Slab
- Roof: Composition
Condition
- Year built: 1959
Community & HOA
Location
- Region: Oklahoma City
Financial & listing details
- Price per square foot: $65/sqft
- Tax assessed value: $206,000
- Annual tax amount: $2,972
- Date on market: 11/5/2026
Foreclosure details
Estimated market value
$217,400
$204,000 - $230,000
$1,619/mo
Price history
| Date | Event | Price |
|---|---|---|
| 5/15/2023 | Sold | $205,000$113/sqft |
Source:  MLSOK/OKCMAR as distributed by MLS GRID #1039037 Report a problem | ||
| 1/6/2023 | Pending sale | $205,000$113/sqft |
Source: MLSOK/OKCMAR as distributed by MLS GRID #1039037 Report a problem | ||
| 12/6/2022 | Price change | $205,000+5.1%$113/sqft |
Source: MLSOK/OKCMAR as distributed by MLS GRID #1039037 Report a problem | ||
| 12/1/2022 | Price change | $195,000-4.9%$107/sqft |
Source: MLSOK/OKCMAR as distributed by MLS GRID #1039037 Report a problem | ||
| 11/16/2022 | Listed for sale | $205,000+3%$113/sqft |
Source: MLSOK/OKCMAR as distributed by MLS GRID #1039037 Report a problem | ||
| 12/25/2021 | Listing removed | -- |
Source: MLSOK/OKCMAR as distributed by MLS GRID #959346 Report a problem | ||
| 8/16/2021 | Price change | $199,000-11.6%$109/sqft |
Source: MLSOK/OKCMAR as distributed by MLS GRID #959346 Report a problem | ||
| 5/27/2021 | Listed for sale | $225,000+25.7%$124/sqft |
Source: MLSOK/OKCMAR as distributed by MLS GRID #959346 Report a problem | ||
| 8/15/2020 | Listing removed | $179,000$98/sqft |
Source: Chamberlain Realty LLC #901185 Report a problem | ||
| 7/16/2020 | Price change | $179,000-1.6%$98/sqft |
Source: Chamberlain Realty LLC #901185 Report a problem | ||
| 2/23/2020 | Listed for sale | $182,000+114.1%$100/sqft |
Source: Chamberlain Realty LLC #901185 Report a problem | ||
| 6/6/2019 | Sold | $85,000-3.4%$47/sqft |
Source: MLSOK/OKCMAR as distributed by MLS GRID #834802 Report a problem | ||
| 5/14/2019 | Pending sale | $88,000$48/sqft |
Source: All Pro Realty, Inc #834802 Report a problem | ||
| 5/9/2019 | Listed for sale | $88,000$48/sqft |
Source: All Pro Realty, Inc #834802 Report a problem | ||
| 5/3/2019 | Pending sale | $88,000$48/sqft |
Source: All Pro Realty, Inc #834802 Report a problem | ||
| 4/24/2019 | Listed for sale | $88,000$48/sqft |
Source: All Pro Realty, Inc #834802 Report a problem | ||
| 3/8/2019 | Pending sale | $88,000$48/sqft |
Source: All Pro Realty, Inc #834802 Report a problem | ||
| 9/13/2018 | Listed for sale | $88,000$48/sqft |
Source: All Pro Realty, Inc #834802 Report a problem | ||
Public tax history
| Year | Property taxes | Tax assessment |
|---|---|---|
| 2025 | $2,972 -0.8% | $22,660 +0.2% |
| 2024 | $2,997 +40.6% | $22,605 +42.6% |
| 2023 | $2,132 +8.8% | $15,852 +5% |
| 2022 | $1,959 +3.6% | $15,097 +5% |
| 2021 | $1,891 +3.6% | $14,379 +5% |
| 2020 | $1,825 +71.7% | $13,695 +20.9% |
| 2019 | $1,063 +46.5% | $11,330 +29.7% |
| 2018 | $726 -22.8% | $8,736 +0% |
| 2017 | $940 | $8,735 |
| 2016 | $940 -1% | $8,735 0% |
| 2015 | $949 +12.1% | $8,736 +0% |
| 2014 | $846 | $8,735 |
| 2013 | -- | $8,735 |
| 2012 | -- | $8,735 |
| 2011 | -- | $8,735 0% |
| 2010 | -- | $8,736 +0% |
| 2009 | -- | $8,735 -26.6% |
| 2008 | -- | $11,899 +43% |
| 2007 | -- | $8,319 +5% |
| 2006 | -- | $7,924 +5% |
| 2005 | -- | $7,546 -88.5% |
| 2004 | $674 | $65,343 +809.2% |
| 2003 | -- | $7,187 -14.2% |
| 2002 | -- | $8,375 -5% |
| 2001 | -- | $8,815 +19.1% |
| 2000 | -- | $7,403 +31.5% |
| 1999 | -- | $5,630 |
Find assessor info on the county website
Monthly payment
Climate risks
Neighborhood: Adventure District
Nearby schools
Schools provided by the listing agent
- Elementary: Millwood ES
- Middle: Millwood MS
- High: Millwood HS
Source: MLSOK/OKCMAR as distributed by MLS GRID. This data may not be complete. We recommend contacting the local school district to confirm school assignments for this home.
- $178,9003 bd2 ba1.4k sqft1148 NE 59th St, Oklahoma City, OK 73111Off Market

- $180,5002 bd2 ba1.9k sqft1156 NE 59th St, Oklahoma City, OK 73111Off Market
- $154,6003 bd1 ba1.5k sqft1144 NE 59th St, Oklahoma City, OK 73111Off Market
- $141,4003 bd1 ba1.4k sqft1200 NE 59th St, Oklahoma City, OK 73111Off Market
Similar homes
- $119,9002 bd1 ba1.2k sqft2221 N Jordan Ave, Oklahoma City, OK 73111For Sale
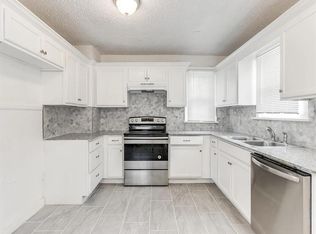 MLS ID #1256784, Brooke Bale, CityGates Real Estate LLC. MLSOK/OKCMAR as distributed by MLS GRID
- $125,0003 bd2 ba1.2k sqft1201 NE 45th St, Oklahoma City, OK 73111For Sale
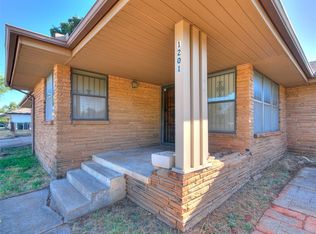 MLS ID #1249036, Angela Rogers, RE/MAX Gemini. MLSOK/OKCMAR as distributed by MLS GRID
- $150,0004 bd2 ba1.5k sqft540 SE 26th St, Oklahoma City, OK 73129For Sale
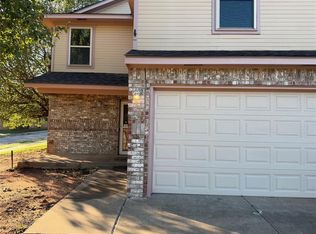 MLS ID #1256729, Tyler Weinrich, Homestead + Co. MLSOK/OKCMAR as distributed by MLS GRID
- $160,0003 bd1 ba984 sqft201 NW 85th St, Oklahoma City, OK 73114For Sale
 MLS ID #1252696, Tara Levinson, LRE Realty, LLC. MLSOK/OKCMAR as distributed by MLS GRID
