This 1212 square foot single family home has 4 bedrooms and 2.0 bathrooms. This home is located at 230 Sterling Rd, Bakersfield, CA 93307.
Foreclosed
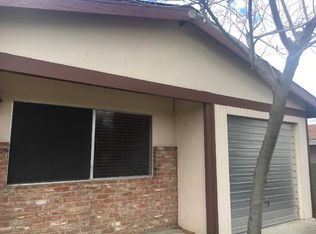
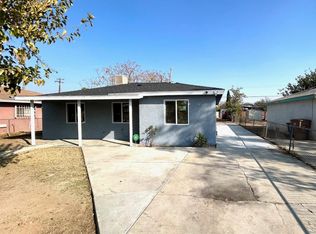
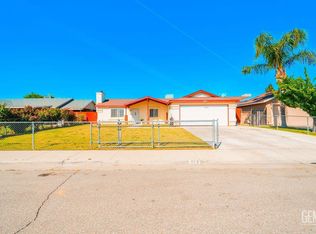
Street View
Est. $329,600
230 Sterling Rd, Bakersfield, CA 93307
4beds
2baths
1,212sqft
SingleFamily
Built in 1968
9,147 Square Feet Lot
$329,600 Zestimate®
$272/sqft
$-- HOA
Overview
- 436 days |
- 40 |
- 1 |
Facts & features
Interior
Bedrooms & bathrooms
- Bedrooms: 4
- Bathrooms: 2
Heating
- Wall
Cooling
- Other
Interior area
- Total interior livable area: 1,212 sqft
Property
Lot
- Size: 9,147 Square Feet
Details
- Parcel number: 14313016
Construction
Type & style
- Home type: SingleFamily
Materials
- wood frame
Condition
- Year built: 1968
Community & HOA
Location
- Region: Bakersfield
Financial & listing details
- Price per square foot: $272/sqft
- Tax assessed value: $48,576
- Annual tax amount: $1,333
Visit our professional directory to find a foreclosure specialist in your area that can help with your home search.
Find a foreclosure agentForeclosure details
Estimated market value
$329,600
$307,000 - $353,000
$2,177/mo
Price history
| Date | Event | Price |
|---|---|---|
| 3/1/2024 | Listing removed | -- |
Source: | ||
| 8/15/2022 | Pending sale | $190,000+630.8%$157/sqft |
Source: | ||
| 10/28/1999 | Sold | $26,000$21/sqft |
Source: Public Record Report a problem | ||
Public tax history
| Year | Property taxes | Tax assessment |
|---|---|---|
| 2025 | $1,333 +1.8% | $48,576 +2% |
| 2024 | $1,309 +3.6% | $47,624 +2% |
| 2023 | $1,264 +6% | $46,691 +2% |
| 2022 | $1,192 | $45,776 +2% |
| 2021 | -- | $44,879 +1% |
| 2020 | $1,051 +1.8% | $44,419 |
| 2019 | $1,032 +3% | $44,419 +4% |
| 2018 | $1,003 +1.6% | $42,696 +2% |
| 2017 | $986 +5.9% | $41,860 +2% |
| 2016 | $932 +0.8% | $41,040 +1.5% |
| 2015 | $925 +1.8% | $40,425 +2% |
| 2014 | $908 | $39,634 +0.5% |
| 2013 | -- | $39,456 +2% |
| 2012 | $858 +5.5% | $38,683 +2% |
| 2011 | $813 +3.1% | $37,926 +0.8% |
| 2010 | $789 -49.4% | $37,643 -64.2% |
| 2009 | $1,560 +104.3% | $105,116 +184.1% |
| 2008 | $764 +2.2% | $36,995 +2% |
| 2007 | $747 +3.5% | $36,270 +2% |
| 2006 | $722 -12.8% | $35,560 +2% |
| 2005 | $828 -5.6% | $34,863 |
| 2004 | $877 +4.9% | $34,863 +1.9% |
| 2003 | $836 | $34,225 +4% |
| 2002 | $836 +3.3% | $32,898 +2% |
| 2001 | $810 | $32,254 |
| 2000 | -- | $32,254 |
Find assessor info on the county website
Monthly payment
Estimated monthly payment$1,822
All calculations are estimates and provided by Zillow, Inc. for informational purposes only. Actual amounts may vary.
HOA fees may include property taxes on listings classified as Co-Ops. Contact the listing agent and/or owner for fee details.
Mortgage interest rates are dependent on a number of factors, including credit score, down payment, and repayment length. Interest rate data provided by Zillow Group Marketplace, Inc. as of 1/1/1970 from various mortgage lenders with which we have lead or other similar arrangements; the Estimated Payment is an average of those rates.
See how much you could borrow to make a competitive offer.
Climate risks
Neighborhood: East Niles
Nearby schools
GreatSchools rating
- 5/10Virginia Avenue Elementary SchoolGrades: K-6Distance: 0.4 mi
- 3/10Fairfax Middle SchoolGrades: 5-8Distance: 1.6 mi
- 3/10Mira Monte High SchoolGrades: 9-12Distance: 1.8 mi


- California
- Kern County
- Bakersfield
- 93307
- East Niles
- 230 Sterling Rd
Nearby cities
Nearby neighborhoods
Nearby zip codes
Other Bakersfield Topics
