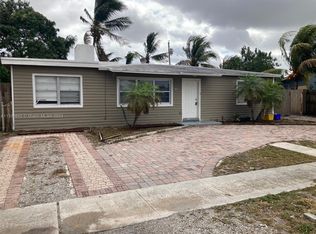
$325,400
-- bd|1 ba|936 sqft
2349 Beech Rd, West Palm Beach, FL 33409
Off Market
Zillow last checked:
Listing updated:
Alejandro Obregon Ibarra 561-425-4463,
Partnership Realty Inc.
$418,500
$398,000 - $439,000
$2,177/mo
| Date | Event | Price |
|---|---|---|
| 3/10/2026 | Pending sale | $425,000$347/sqft |
Source: | ||
| 1/20/2026 | Listed for sale | $425,000+49.1%$347/sqft |
Source: | ||
| 10/15/2025 | Sold | $285,000-5%$233/sqft |
Source: | ||
| 8/28/2025 | Listed for sale | $299,900+254.9%$245/sqft |
Source: | ||
| 7/10/2025 | Listing removed | $2,785$2/sqft |
Source: Zillow Rentals Report a problem | ||
| 7/9/2025 | Price change | $2,785-0.9%$2/sqft |
Source: Zillow Rentals Report a problem | ||
| 7/5/2025 | Price change | $2,810-20.8%$2/sqft |
Source: Zillow Rentals Report a problem | ||
| 7/2/2025 | Listed for rent | $3,550+129.2%$3/sqft |
Source: Zillow Rentals Report a problem | ||
| 6/28/2019 | Listing removed | $1,549$1/sqft |
Source: HavenBrook Homes Report a problem | ||
| 4/17/2019 | Listed for rent | $1,549+14.8%$1/sqft |
Source: HavenBrook Homes Report a problem | ||
| 1/26/2017 | Listing removed | $1,349$1/sqft |
Source: HavenBrook Homes Report a problem | ||
| 1/21/2017 | Listed for rent | $1,349$1/sqft |
Source: HavenBrook Homes Report a problem | ||
| 1/14/2014 | Sold | $84,500-6%$69/sqft |
Source: Public Record Report a problem | ||
| 11/18/2013 | Listed for sale | $89,900$73/sqft |
Source: United Real Estate Inc. #RX-9994397 Report a problem | ||
| Year | Property taxes | Tax assessment |
|---|---|---|
| 2024 | $5,414 +5% | $299,657 +9.1% |
| 2023 | $5,155 +6.9% | $274,750 +10% |
| 2022 | $4,824 +9.1% | $249,773 +10% |
| 2021 | $4,423 +2.2% | $227,066 +4.2% |
| 2020 | $4,328 +8.6% | $217,810 +10% |
| 2019 | $3,984 | $198,009 +20.7% |
| 2018 | $3,984 +27.6% | $164,100 +14.2% |
| 2017 | $3,122 +10% | $143,668 +14.9% |
| 2016 | $2,838 +7.7% | $125,029 +34% |
| 2015 | $2,635 +21.5% | $93,297 -1.6% |
| 2014 | $2,169 +128.2% | $94,829 +50.7% |
| 2013 | $951 +11.4% | $62,910 +27.4% |
| 2012 | $854 +2.1% | $49,367 +3% |
| 2011 | $836 -1.8% | $47,929 -2.4% |
| 2010 | $851 -7.9% | $49,123 -22.1% |
| 2009 | $924 +10.3% | $63,034 +0.1% |
| 2008 | $838 -2.2% | $62,971 +3% |
| 2007 | $857 -7.6% | $61,137 +2.5% |
| 2006 | $927 | $59,646 +3% |
| 2005 | -- | $57,909 +3% |
| 2004 | $324 +49.9% | $56,222 +1.9% |
| 2003 | $216 -72.2% | $55,174 +2.4% |
| 2002 | $776 +1.3% | $53,881 +1.6% |
| 2001 | $766 +5.5% | $53,032 +3% |
| 2000 | $726 +48% | $51,487 -11.8% |
| 1999 | $490 | $58,358 |
Find assessor info on the county website
A local agent can set up tours, give advice and negotiate with sellers.