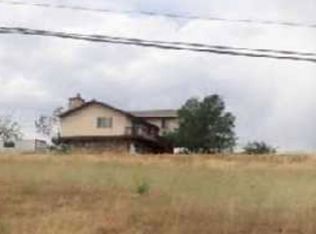
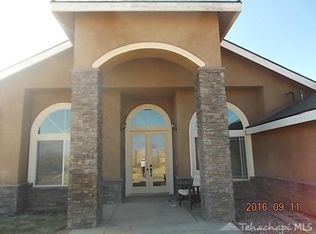
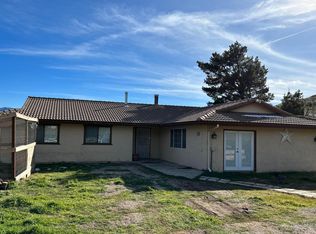
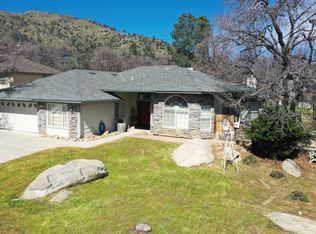
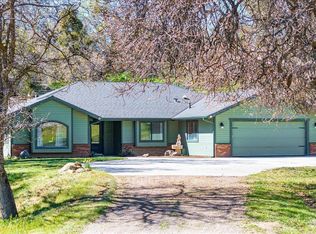
Incredible opportunity. This home has spectacular views! Very comfortable floor plan. There are 2 separate living areas, large rooms...decks off every level. The property is amazing, level area with rooms for all your horses,,, and the barn / workshop at 30' x 80' fullfills the dreams of everyone!!! Totally insulated and room for every toy imaginable! Also includes shop (30x80) Call now for a private showing!!!
Pre-foreclosure
Est. $545,400
23980 Woodford Tehachapi Rd, Tehachapi, CA 93561
4beds
2,379sqft
Residential, Single Family Residence
Built in 1991
2.75 Acres Lot
$545,400 Zestimate®
$229/sqft
$-- HOA
What's special
Comfortable floor planSpectacular viewsLarge rooms
- 196 days |
- 62 |
- 2 |
Zillow last checked: 7 hours ago
Listing updated: May 31, 2023 at 03:54pm
Listed by:
Terri Juergens 661-303-6868,
Country Real Estate
Source: TAAR,MLS#: 9987090Originating MLS: Tehachapi MLS
Facts & features
Interior
Bedrooms & bathrooms
- Bedrooms: 4
- Bathrooms: 3
- Full bathrooms: 3
Rooms
- Room types: Den, Family Room, Master Bedroom, Workshop
Interior area
- Total structure area: 2,379
- Total interior livable area: 2,379 sqft
Property
Parking
- Parking features: Attached
- Has attached garage: Yes
Features
- Has view: Yes
Lot
- Size: 2.75 Acres
- Features: Bluff, Level, Views
Details
- Additional structures: Detached Workshop
- Parcel number: 22204219
- Lease amount: $0
- Zoning: E
Construction
Type & style
- Home type: SingleFamily
- Property subtype: Residential, Single Family Residence
Materials
- Roof: Tile
Condition
- Year built: 1991
Community & HOA
Location
- Region: Tehachapi
Financial & listing details
- Price per square foot: $229/sqft
- Tax assessed value: $517,078
- Annual tax amount: $6,113
- Date on market: 4/16/2023
Visit our professional directory to find a foreclosure specialist in your area that can help with your home search.
Find a foreclosure agentForeclosure details
Estimated market value
$545,400
$518,000 - $573,000
$2,895/mo
Price history
Price history
| Date | Event | Price |
|---|---|---|
| 5/31/2023 | Sold | $497,000-2.5%$209/sqft |
Source: TAAR #9987090 Report a problem | ||
| 4/16/2023 | Pending sale | $510,000$214/sqft |
Source: TAAR #9987090 Report a problem | ||
| 4/16/2023 | Listed for sale | $510,000$214/sqft |
Source: TAAR #9987090 Report a problem | ||
| 11/16/2022 | Listing removed | -- |
Source: | ||
| 11/7/2022 | Listed for sale | $510,000$214/sqft |
Source: TAAR #9986260 Report a problem | ||
| 10/21/2022 | Pending sale | $510,000$214/sqft |
Source: TAAR #9986260 Report a problem | ||
| 10/14/2022 | Price change | $510,000-2.9%$214/sqft |
Source: TAAR #9986260 Report a problem | ||
| 9/17/2022 | Listed for sale | $525,000+97.4%$221/sqft |
Source: TAAR #9986260 Report a problem | ||
| 10/13/2010 | Sold | $266,000+20.1%$112/sqft |
Source: Public Record Report a problem | ||
| 12/31/2009 | Sold | $221,500-54.8%$93/sqft |
Source: Public Record Report a problem | ||
| 9/15/2006 | Sold | $490,000$206/sqft |
Source: Public Record Report a problem | ||
Public tax history
Public tax history
| Year | Property taxes | Tax assessment |
|---|---|---|
| 2025 | $6,113 +0.7% | $517,078 +2% |
| 2024 | $6,070 +6% | $506,940 +4.4% |
| 2023 | $5,724 +30.7% | $485,520 +51.2% |
| 2022 | $4,381 | $321,129 +2% |
| 2021 | -- | $314,833 +1% |
| 2020 | $3,871 +0% | $311,605 |
| 2019 | $3,870 +3.7% | $311,605 +4% |
| 2018 | $3,733 +0.1% | $299,506 +2% |
| 2017 | $3,728 +2.8% | $293,634 +2% |
| 2016 | $3,628 +5.1% | $287,878 +1.5% |
| 2015 | $3,451 +1.1% | $283,555 +2% |
| 2014 | $3,413 | $278,002 +0.5% |
| 2013 | -- | $276,746 +2% |
| 2012 | $3,179 +1.8% | $271,320 +2% |
| 2011 | $3,122 +19.3% | $266,000 +20.1% |
| 2010 | $2,617 -23.6% | $221,500 -25.2% |
| 2009 | $3,423 -41.5% | $296,253 -40.7% |
| 2008 | $5,850 +2% | $499,800 +2% |
| 2007 | $5,735 +73.9% | $490,000 +66.2% |
| 2006 | $3,298 +15.8% | $294,838 +24.9% |
| 2005 | $2,849 -0.5% | $236,117 |
| 2004 | $2,865 +19.1% | $236,117 +24.3% |
| 2003 | $2,405 | $190,000 |
| 2002 | $2,405 +4.6% | $190,000 |
| 2001 | $2,299 | $190,000 |
| 2000 | -- | $190,000 |
Find assessor info on the county website
BuyAbility℠ payment
Estimated monthly payment
All calculations are estimates and provided by Zillow, Inc. for informational purposes only. Actual amounts may vary.
HOA fees may include property taxes on listings classified as Co-Ops. Contact the listing agent and/or owner for fee details.
Mortgage interest rates are dependent on a number of factors, including credit score, down payment, and repayment length. Interest rate data provided by Zillow Group Marketplace, Inc. as of 1/1/1970 from various mortgage lenders with which we have lead or other similar arrangements; the Estimated Payment is an average of those rates.
See how much you could borrow to make a competitive offer.
Boost your down payment with 6% savings match
Earn up to a 6% match & get a competitive APY with a *. Zillow has partnered with to help get you home faster.
Learn more*Terms apply. Match provided by Foyer. Account offered by Pacific West Bank, Member FDIC.Climate risks
Neighborhood: Golden Hills
Nearby schools
GreatSchools rating
- 5/10Golden Hills Elementary SchoolGrades: K-5Distance: 2.8 mi
- 2/10Jacobsen Middle SchoolGrades: 6-8Distance: 4.5 mi
- 5/10Tehachapi High SchoolGrades: 9-12Distance: 4.9 mi
- California
- Kern County
- Tehachapi
- 93561
- Golden Hills
- 23980 Woodford Tehachapi Rd
Nearby cities
Nearby neighborhoods
Nearby zip codes
Other Tehachapi Topics
