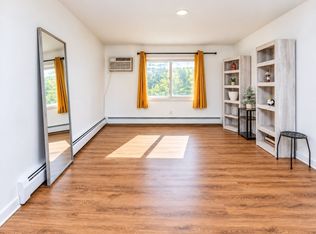
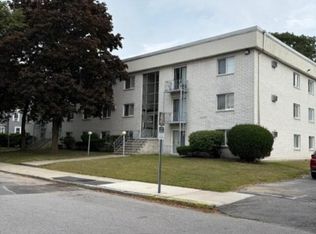
OFFERED AS-IS AT THIS PRICE FOR 1 WEEK ONLY. BEFORE REMODELING BEGINS. ALL OFFERS DUE NOV 01, 2026 in PDA FORMAT. PRICE AFTER 11/01/26 WILL BE INCREASED ACCORDINGLY.Boutique property in South Lawrence. Wonderful, private, bright, airy, top floor condo! Heat, hot water, gas cooking, water, sewer, parking, reserves, professional management and more included in the condo fee! Well run, professionally managed property.
For sale
$229,999
24 Inman St APT 35, Lawrence, MA 01843
2beds
781sqft
Condominium
Built in 1975
-- sqft lot
$231,600 Zestimate®
$294/sqft
$9,999,999/mo HOA
What's special
- 22 hours
- 98
- 0
Zillow last checked:
Listing updated:
Listed by:
Anthony Ansaldi 978-423-3445,
Cameron-Bishop Financial Services, Inc. 978-423-3445,
Anthony Ansaldi 978-423-3445
Source: MLS PIN,MLS#: 73594972
Facts & features
Interior
Bedrooms & bathrooms
- Bedrooms: 2
- Bathrooms: 1
- Full bathrooms: 1
Heating
- Baseboard, Natural Gas
Cooling
- Wall Unit(s)
Appliances
- Laundry: Common Area, In Building
Features
- Has basement: No
- Has fireplace: No
- Common walls with other units/homes: No One Above
Interior area
- Total structure area: 781
- Total interior livable area: 781 sqft
- Finished area above ground: 781
Property
Parking
- Total spaces: 1
- Parking features: Assigned, Off Street, Paved
- Has garage: Yes
- Uncovered spaces: 1
Details
- Parcel number: M:0097 B:0001 L:0021,4203825
- Zoning: R3
Construction
Type & style
- Home type: Condo
- Property subtype: Condominium
- Attached to another structure: Yes
Condition
- Year built: 1975
Utilities & green energy
- Sewer: Public Sewer
- Water: Public
Community & HOA
HOA
- Amenities included: Hot Water
- Services included: Heat, Gas, Water, Sewer, Insurance, Maintenance Grounds, Snow Removal, Reserve Funds
- HOA fee: $9,999,999 monthly
Location
- Region: Lawrence
Financial & listing details
- Price per square foot: $294/sqft
- Tax assessed value: $206,800
- Annual tax amount: $1,787
- Date on market: 10/26/2026
Estimated market value
$231,600
$220,000 - $243,000
$2,156/mo
Price history
| Date | Event | Price |
|---|---|---|
| 10/26/2026 | Listed for sale | $229,999-11.5%$294/sqft |
Source: MLS PIN #73594972 Report a problem | ||
| 11/1/2025 | Listing removed | $259,999$333/sqft |
Source: MLS PIN #73409785 Report a problem | ||
| 10/9/2025 | Price change | $259,999+0%$333/sqft |
Source: MLS PIN #73409785 Report a problem | ||
| 9/9/2025 | Price change | $259,900+0.4%$333/sqft |
Source: MLS PIN #73409785 Report a problem | ||
| 9/4/2025 | Price change | $258,900-0.4%$331/sqft |
Source: MLS PIN #73409785 Report a problem | ||
| 7/26/2025 | Listed for sale | $259,999+205.9%$333/sqft |
Source: MLS PIN #73409785 Report a problem | ||
| 4/5/2016 | Sold | $85,000-10.4%$109/sqft |
Source: Public Record Report a problem | ||
| 4/14/2015 | Listing removed | $94,900$122/sqft |
Source: CENTURY 21 North Shore #71796318 Report a problem | ||
| 3/2/2015 | Listed for sale | $94,900+89.8%$122/sqft |
Source: Century 21 North Shore/Silva #71796318 Report a problem | ||
| 11/1/2012 | Sold | $50,000+0.2%$64/sqft |
Source: Public Record Report a problem | ||
| 8/7/2012 | Listed for sale | $49,900-51.6%$64/sqft |
Source: Re/Max Insight #71418917 Report a problem | ||
| 8/31/2004 | Sold | $103,000+17%$132/sqft |
Source: Public Record Report a problem | ||
| 3/28/2003 | Sold | $88,000+31.3%$113/sqft |
Source: Public Record Report a problem | ||
| 9/13/2001 | Sold | $67,000+67.5%$86/sqft |
Source: Public Record Report a problem | ||
| 6/16/2000 | Sold | $40,000$51/sqft |
Source: Public Record Report a problem | ||
Public tax history
| Year | Property taxes | Tax assessment |
|---|---|---|
| 2024 | $1,671 +6.9% | $180,600 +17.4% |
| 2023 | $1,563 | $153,800 |
| 2022 | $1,563 +19% | $153,800 +43.7% |
| 2021 | $1,313 +20.1% | $107,000 +21.7% |
| 2020 | $1,093 -20.5% | $87,900 -12.5% |
| 2019 | $1,375 +19.5% | $100,500 +25% |
| 2018 | $1,151 +6.9% | $80,400 +14.5% |
| 2017 | $1,077 +14.8% | $70,200 +16% |
| 2016 | $938 +12.3% | $60,500 +9.6% |
| 2015 | $835 -0.9% | $55,200 +2.2% |
| 2014 | $843 -19.8% | $54,000 -22.5% |
| 2013 | $1,051 +3.4% | $69,700 -2% |
| 2012 | $1,016 -28.1% | $71,100 -32.4% |
| 2011 | $1,414 -3.7% | $105,100 -10% |
| 2010 | $1,468 +12.8% | $116,800 -3.9% |
| 2009 | $1,301 +9.7% | $121,600 +2.6% |
| 2008 | $1,186 +20.2% | $118,500 +10.9% |
| 2007 | $987 | $106,900 |
Find assessor info on the county website
Monthly payment
Est. payment
Payment breakdown
Explore the cost of this home by adjusting the details. Changes won't be saved.Climate risks
Neighborhood: 01843


Similar homes
- $224,9001 bd1 ba589 sqftVilla Grande Condominium, Lawrence, MA 01843For Sale
 MLS ID #73590574, Walquiria Leguisamon, Return Realty Group, Inc.. MLS PIN
- $259,0002 bd1 ba872 sqftVilla Grande Condo Association, Lawrence, MA 01843For Sale
 MLS ID #73576008, Michael Sullivan, T.A. Sullivan Agency Inc.. MLS PIN
- $260,0002 bd1 ba689 sqftPrinceton Village Condominiums, Lawrence, MA 01841For Sale
 MLS ID #73588557, Christopher Grant, Keller Williams Realty - Londonderry. MLS PIN
- $274,9992 bd1 ba732 sqftPrinceton Village, Lawrence, MA 01841For Sale
 MLS ID #73582472, Rafael Vega, The Guselli Agency, Inc.. MLS PIN
