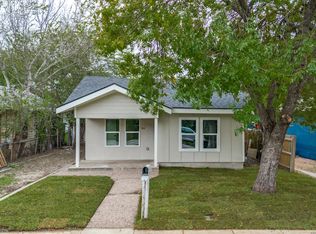
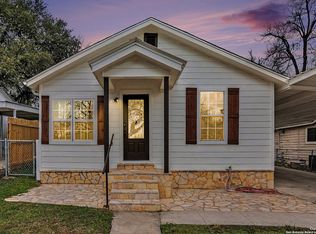
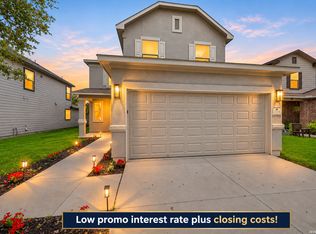
$--
4 bd3 ba2.3k sqft
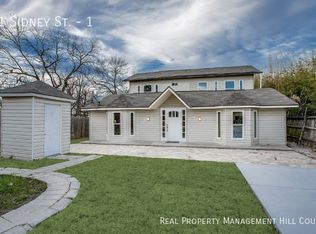
131 Sidney St #1, San Antonio, TX 78203
Off Market
Zillow last checked:
Listing updated:
Terrance Connors TREC #0851663 727-452-6054,
Meridian Reside

Not available
Estimated sales range
Not available
$2,222/mo
| Date | Event | Price |
|---|---|---|
| 11/18/2026 | Listed for sale | $249,950+19.1%$108/sqft |
Source:  HAR #61375930 Report a problem | ||
| 8/11/2026 | Sold | -- |
Source: Public Record Report a problem | ||
| 7/6/2026 | Listed for sale | $209,900$91/sqft |
Source:  LERA MLS #1955455 Report a problem | ||
| 6/18/2026 | Pending sale | $209,900$91/sqft |
Source: LERA MLS #1955455 Report a problem | ||
| 5/29/2026 | Contingent | $209,900$91/sqft |
Source: LERA MLS #1955455 Report a problem | ||
| 4/6/2026 | Listed for sale | $209,900$91/sqft |
Source: LERA MLS #1955455 Report a problem | ||
| 12/2/2025 | Listing removed | $209,900$91/sqft |
Source: LERA MLS #1920430 Report a problem | ||
| 11/14/2025 | Pending sale | $209,900$91/sqft |
Source: LERA MLS #1920430 Report a problem | ||
| 11/4/2025 | Contingent | $209,900$91/sqft |
Source: LERA MLS #1920430 Report a problem | ||
| 10/28/2025 | Listing removed | $209,900$91/sqft |
Source: LERA MLS #1867025 Report a problem | ||
| 9/9/2025 | Price change | $209,900-3.5%$91/sqft |
Source: LERA MLS #1867025 Report a problem | ||
| 8/5/2025 | Price change | $217,500-3.3%$94/sqft |
Source: LERA MLS #1867025 Report a problem | ||
| 7/15/2025 | Price change | $225,000-8.1%$98/sqft |
Source: LERA MLS #1867025 Report a problem | ||
| 6/11/2025 | Price change | $244,750-2%$106/sqft |
Source: LERA MLS #1867025 Report a problem | ||
| 5/15/2025 | Listed for sale | $249,850-6.6%$108/sqft |
Source: LERA MLS #1867025 Report a problem | ||
| 4/18/2025 | Listing removed | $267,500$116/sqft |
Source: LERA MLS #1838744 Report a problem | ||
| 3/19/2025 | Price change | $267,500-2.7%$116/sqft |
Source: LERA MLS #1838744 Report a problem | ||
| 2/1/2025 | Listed for sale | $275,000-8.3%$119/sqft |
Source: LERA MLS #1838744 Report a problem | ||
| 5/10/2022 | Listing removed | -- |
Source: LERA MLS #1597760 Report a problem | ||
| 4/27/2022 | Price change | $300,000-6%$130/sqft |
Source: LERA MLS #1597760 Report a problem | ||
| 4/12/2022 | Price change | $319,000-8.9%$138/sqft |
Source: LERA MLS #1597760 Report a problem | ||
| 4/7/2022 | Listed for sale | $350,000+0%$152/sqft |
Source: LERA MLS #1597760 Report a problem | ||
| 2/12/2022 | Listing removed | -- |
Source: LERA MLS #1580606 Report a problem | ||
| 2/7/2022 | Price change | $349,900-6.7%$152/sqft |
Source: LERA MLS #1580606 Report a problem | ||
| 1/24/2022 | Listed for sale | $374,900$163/sqft |
Source: LERA MLS #1580606 Report a problem | ||
| Year | Property taxes | Tax assessment |
|---|---|---|
| 2026 | -- | $308,000 -4.6% |
| 2025 | $7,517 -4.6% | $323,000 |
| 2024 | $7,882 +0.4% | $323,000 -4.6% |
| 2023 | $7,852 -11.2% | $338,580 +3.8% |
| 2022 | $8,838 +28.6% | $326,180 +32.4% |
| 2021 | $6,871 | $246,450 +0.6% |
| 2020 | $6,871 +13.6% | $244,900 +14.8% |
| 2019 | $6,047 | $213,350 +43.3% |
| 2018 | $6,047 +78.9% | $148,870 +10% |
| 2017 | $3,379 +9.3% | $135,336 +10% |
| 2016 | $3,093 +21.7% | $123,033 +10% |
| 2015 | $2,542 | $111,848 +10% |
| 2014 | $2,542 | $101,680 +7.9% |
| 2013 | -- | $94,270 -1% |
| 2012 | -- | $95,220 -6.4% |
| 2011 | -- | $101,770 +4% |
| 2010 | -- | $97,841 +10% |
| 2009 | -- | $88,946 +10% |
| 2008 | -- | $80,860 -10.5% |
| 2007 | -- | $90,350 -23.9% |
| 2006 | -- | $118,750 +97.9% |
| 2005 | -- | $60,000 |
| 2004 | -- | -- |
| 2003 | -- | -- |
| 2002 | -- | -- |
Source: HAR. This data may not be complete. We recommend contacting the local school district to confirm school assignments for this home.
A local agent can set up tours, give advice and negotiate with sellers.