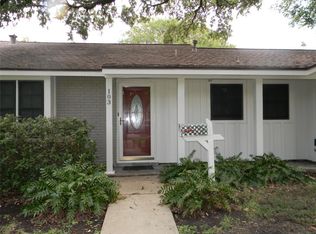
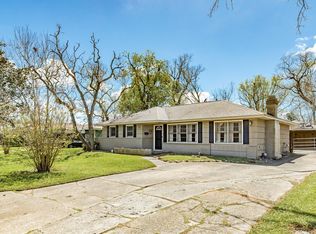
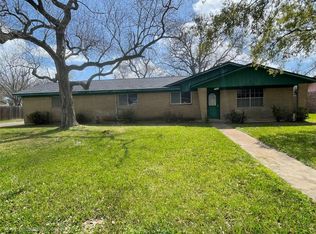
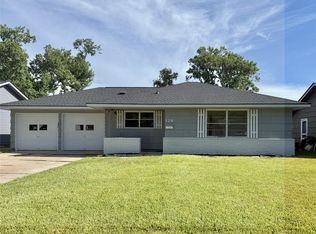
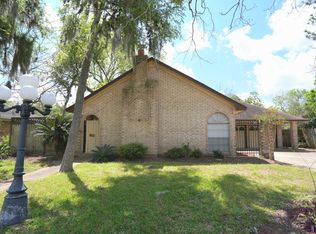
Look no further, this property is the perfect starter home! 3 bedrooms, 2 bath and a flex room/game-room. Located in the heart of Lake Jackson. The kitchen offers tons of storage and work space for the chef in the family. There is beautiful solid wood flooring in the living area as well as 2 of the bedrooms. This cutie has been completely updated and waiting for you to call it "home". This home has never flooded and located in a zone X, so flood insurance is not required.
Foreclosed
Est. $222,300
203 Chestnut St, Lake Jackson, TX 77566
3beds
1,691sqft
SingleFamily
Built in 1958
10,193 Square Feet Lot
$222,300 Zestimate®
$131/sqft
$-- HOA
Overview
- 36 days |
- 16 |
- 0 |
Facts & features
Interior
Bedrooms & bathrooms
- Bedrooms: 3
- Bathrooms: 2
- Full bathrooms: 2
Heating
- Other, Gas
Cooling
- Central
Features
- Washer/Dryer Connections, Ceiling Fans
- Flooring: Tile, Carpet
Interior area
- Total interior livable area: 1,691 sqft
Property
Parking
- Total spaces: 1
- Parking features: Garage - Attached
Features
- Exterior features: Wood
Lot
- Size: 10,193 Square Feet
Details
- Parcel number: 69550260000
Construction
Type & style
- Home type: SingleFamily
Materials
- brick
- Foundation: Slab
- Roof: Composition
Condition
- Year built: 1958
Community & HOA
Location
- Region: Lake Jackson
Financial & listing details
- Price per square foot: $131/sqft
- Tax assessed value: $222,450
- Annual tax amount: $2,561
Visit our professional directory to find a foreclosure specialist in your area that can help with your home search.
Find a foreclosure agentForeclosure details
Estimated market value
$222,300
$207,000 - $236,000
$2,011/mo
Price history
Price history
| Date | Event | Price |
|---|---|---|
| 2/26/2026 | Sold | -- |
Source: Public Record Report a problem | ||
| 5/18/2023 | Listing removed | -- |
Source: | ||
| 4/18/2023 | Listed for sale | $210,000$124/sqft |
Source: | ||
| 4/12/2023 | Pending sale | $210,000$124/sqft |
Source: | ||
| 3/16/2023 | Price change | $210,000-4.5%$124/sqft |
Source: | ||
| 3/7/2023 | Price change | $220,000-2.2%$130/sqft |
Source: | ||
| 2/23/2023 | Price change | $225,000-2.2%$133/sqft |
Source: | ||
| 2/16/2023 | Pending sale | $230,000$136/sqft |
Source: | ||
| 2/7/2023 | Price change | $230,000-2.1%$136/sqft |
Source: | ||
| 1/23/2023 | Listed for sale | $235,000+24%$139/sqft |
Source: | ||
| 7/8/2019 | Sold | -- |
Source: Agent Provided Report a problem | ||
| 6/4/2019 | Pending sale | $189,500$112/sqft |
Source: Clyde Cone Company #28557721 Report a problem | ||
| 6/2/2019 | Listed for sale | $189,500$112/sqft |
Source: Clyde Cone Company #28557721 Report a problem | ||
Public tax history
Public tax history
| Year | Property taxes | Tax assessment |
|---|---|---|
| 2025 | $2,561 -10.4% | $222,450 -1% |
| 2024 | $2,859 -26.2% | $224,620 -9.1% |
| 2023 | $3,875 -20.2% | $246,990 +11.5% |
| 2022 | $4,859 +5.7% | $221,590 +12.7% |
| 2021 | $4,595 | $196,620 +7.1% |
| 2020 | -- | $183,560 +63.2% |
| 2019 | $2,669 +56.5% | $112,450 -20.5% |
| 2018 | $1,705 | $141,490 +104.2% |
| 2017 | $1,705 +62.4% | $69,290 +3% |
| 2016 | $1,050 | $67,290 +7.2% |
| 2015 | $1,050 | $62,790 +14.2% |
| 2014 | $1,050 | $55,000 -49.4% |
| 2012 | -- | $108,720 |
| 2011 | -- | $108,720 |
| 2010 | -- | $108,720 +1.3% |
| 2009 | -- | $107,340 +12.9% |
| 2008 | -- | $95,080 +11.1% |
| 2006 | -- | $85,590 +4% |
| 2005 | -- | $82,300 -2.5% |
| 2004 | -- | $84,370 +5.5% |
| 2003 | -- | $79,950 +6.7% |
| 2002 | -- | $74,920 +14.6% |
| 2001 | -- | $65,360 |
Find assessor info on the county website
Monthly payment
Estimated monthly payment
All calculations are estimates and provided by Zillow, Inc. for informational purposes only. Actual amounts may vary.
HOA fees may include property taxes on listings classified as Co-Ops. Contact the listing agent and/or owner for fee details.
Mortgage interest rates are dependent on a number of factors, including credit score, down payment, and repayment length. Interest rate data provided by Zillow Group Marketplace, Inc. as of 1/1/1970 from various mortgage lenders with which we have lead or other similar arrangements; the Estimated Payment is an average of those rates.
See how much you could borrow to make a competitive offer.
Climate risks
Neighborhood: Parkwood
Nearby schools
GreatSchools rating
- 7/10A P Beutel Elementary SchoolGrades: K-4Distance: 0.5 mi
- 8/10Lake Jackson Intermediate SchoolGrades: 7-8Distance: 1.3 mi
- 4/10Brazoswood High SchoolGrades: 9-12Distance: 1.1 mi
Schools provided by the listing agent
- District: Brazosport
Source: The MLS. This data may not be complete. We recommend contacting the local school district to confirm school assignments for this home.
- Texas
- Brazoria County
- Lake Jackson
- 77566
- Parkwood
- 203 Chestnut St
Nearby cities
Nearby neighborhoods
Nearby zip codes
Other Lake Jackson Topics
