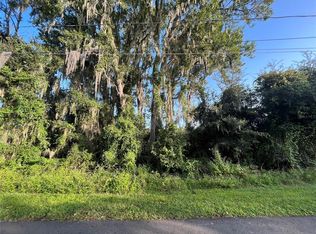
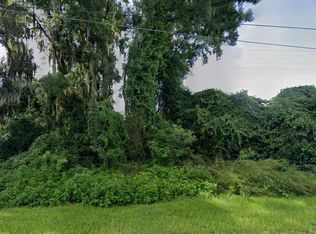
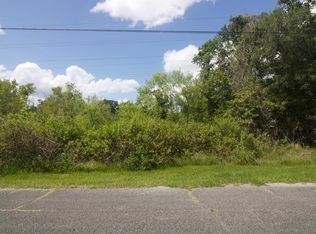
OWNER FINANCE AVAILABLE! Rare Opportunity in DeBary! Invest in this spacious vacant lot at 270 Toms Rd, located in a quiet, established neighborhood with no HOA. This lot offers a great mix of privacy and convenience, just minutes from shopping, dining, and major highways for an easy commute. Additional adjacent lots also available: 262, 264, 266, and 268 Toms Rd—perfect for added space or development potential. For questions regarding land use, building requirements, or zoning, please phone the City of DeBary Zoning Department directly. Don't miss out on this growing area—secure your piece of DeBary today!
Lot/land
$36,899
270 Toms Road, Debary, FL 32713
--beds
--baths
--sqft
Unimproved Land
Built in ----
-- sqft lot
$-- Zestimate®
$--/sqft
$-- HOA
What's special
- 28 days |
- 27 |
- 2 |
Zillow last checked: 7 hours ago
Listing updated: March 09, 2026 at 09:18am
Listed by:
Daniel Castaneda 772-200-5418,
American Realty of PSL LLC,
Tina Castaneda 772-303-1582,
American Realty of PSL LLC
Source: BeachesMLS,MLS#: R11109036 Originating MLS: BeachesMLS
Facts & features
Interior
Video & virtual tour
Property
Lot
- Features: 1/4 to 1/2 Acre Lot, Subdivision
- Residential vegetation: Other
Details
- Parcel number: 803441040230
- Zoning: RES
Utilities & green energy
- Utilities for property: None
Community & HOA
Community
- Subdivision: PLANTATION ESTATES UNIT 31
HOA
- Has HOA: No
Location
- Region: Debary
Financial & listing details
- Tax assessed value: $21,316
- Annual tax amount: $411
- Date on market: 3/6/2026
- Cumulative days on market: 232 days
- Listing terms: Cash,Owner Will Carry
- Road surface type: Paved
Estimated market value
Not available
Estimated sales range
Not available
$1,644/mo
Price history
Price history
| Date | Event | Price |
|---|---|---|
| 3/6/2026 | Listed for sale | $36,899 |
Source: | ||
| 2/6/2026 | Pending sale | $36,899 |
Source: | ||
| 1/22/2026 | Price change | $36,8990% |
Source: | ||
| 12/15/2025 | Price change | $36,900-5.1% |
Source: | ||
| 11/14/2025 | Price change | $38,900-2.5% |
Source: | ||
| 8/15/2025 | Price change | $39,900-7% |
Source: | ||
| 7/20/2025 | Listed for sale | $42,900+22.6% |
Source: | ||
| 9/25/2023 | Sold | $35,000-29.9% |
Source: | ||
| 8/4/2023 | Pending sale | $49,900 |
Source: | ||
| 7/26/2023 | Listed for sale | $49,900+399% |
Source: | ||
| 10/14/2017 | Listing removed | $10,000 |
Source: SAND DOLLAR REALTY GROUP INC #O5406310 Report a problem | ||
| 4/15/2016 | Price change | $10,000-16.7% |
Source: SAND DOLLAR REALTY GROUP INC #O5406310 Report a problem | ||
| 11/25/2015 | Listed for sale | $12,000-20% |
Source: SAND DOLLAR REALTY GROUP INC #O5406310 Report a problem | ||
| 12/18/2014 | Listing removed | $15,000 |
Source: Sand Dollar Realty Group, Inc. #O5199773 Report a problem | ||
| 12/19/2013 | Listed for sale | $15,000 |
Source: Sand Dollar Realty Group, Inc. #O5199773 Report a problem | ||
Public tax history
Public tax history
| Year | Property taxes | Tax assessment |
|---|---|---|
| 2024 | $411 +50.1% | $21,316 +114.1% |
| 2023 | $274 +12.3% | $9,956 +10% |
| 2022 | $244 | $9,051 +10% |
| 2021 | -- | $8,228 +10% |
| 2020 | $227 | $7,480 -19.2% |
| 2019 | $227 -3.7% | $9,260 +12.8% |
| 2018 | $235 +6.9% | $8,212 +34.7% |
| 2017 | $220 +6.4% | $6,097 -1.6% |
| 2016 | $207 +3.9% | $6,194 +33.3% |
| 2015 | $199 +56.6% | $4,645 +8% |
| 2014 | $127 | $4,301 +4.2% |
| 2013 | -- | $4,129 +7.8% |
| 2012 | -- | $3,832 -8.3% |
| 2011 | -- | $4,181 -38.5% |
| 2010 | -- | $6,794 -49% |
| 2009 | -- | $13,309 -40.3% |
| 2007 | -- | $22,298 +26.3% |
| 2006 | -- | $17,660 +261.9% |
| 2005 | -- | $4,880 +33.8% |
| 2004 | -- | $3,648 |
| 2003 | -- | $3,648 +24.9% |
| 2002 | -- | $2,920 |
| 2001 | -- | $2,920 |
| 2000 | -- | $2,920 |
Find assessor info on the county website
Monthly payment
Estimated monthly payment
All calculations are estimates and provided by Zillow, Inc. for informational purposes only. Actual amounts may vary.
HOA fees may include property taxes on listings classified as Co-Ops. Contact the listing agent and/or owner for fee details.
Mortgage interest rates are dependent on a number of factors, including credit score, down payment, and repayment length. Interest rate data provided by Zillow Group Marketplace, Inc. as of 1/1/1970 from various mortgage lenders with which we have lead or other similar arrangements; the Estimated Payment is an average of those rates.
See how much you could borrow to make a competitive offer.
Climate risks
Neighborhood: 32713
Nearby schools
GreatSchools rating
- 6/10Enterprise Elementary SchoolGrades: PK-5Distance: 1.5 mi
- 4/10River Springs Middle SchoolGrades: 6-8Distance: 4.9 mi
- 5/10University High SchoolGrades: 9-12Distance: 4.2 mi
Local experts in 32713


- Florida
- Volusia County
- Debary
- 32713
- 270 Toms Road
Nearby cities
Nearby zip codes
Other Debary Topics
