$124,500
-- bd|1 ba|1k sqft
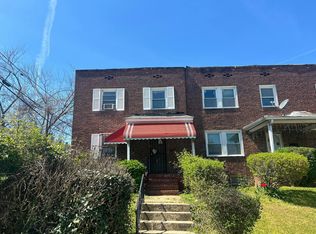
2723 N Rosedale St, Baltimore, MD 21216
Off Market
Zillow last checked:
Listing updated:
Joseph Jones 443-690-1248,
Keller Williams Legacy 4436609229
Not available
Estimated sales range
Not available
Not available
| Date | Event | Price |
|---|---|---|
| 5/8/2026 | Listed for sale | $140,000-20%$89/sqft |
Source: | ||
| 1/31/2023 | Sold | $175,000$112/sqft |
Source: Public Record Report a problem | ||
| 11/18/2022 | Sold | $175,000$112/sqft |
Source: | ||
| 10/6/2022 | Pending sale | $175,000$112/sqft |
Source: | ||
| 9/29/2022 | Listed for sale | $175,000$112/sqft |
Source: | ||
| 9/28/2022 | Pending sale | $175,000$112/sqft |
Source: | ||
| 9/23/2022 | Listed for sale | $175,000+10837.5%$112/sqft |
Source: | ||
| 2/25/2021 | Listing removed | -- |
Source: Owner Report a problem | ||
| 7/10/2020 | Listing removed | $1,350$1/sqft |
Source: Owner Report a problem | ||
| 6/26/2020 | Listed for rent | $1,350$1/sqft |
Source: Owner Report a problem | ||
| 10/15/2019 | Sold | $1,600-96.5%$1/sqft |
Source: Public Record Report a problem | ||
| 5/27/2019 | Listing removed | $1,350$1/sqft |
Source: jl jones homes Report a problem | ||
| 5/16/2019 | Listed for rent | $1,350$1/sqft |
Source: jl jones homes Report a problem | ||
| 1/22/2019 | Sold | $45,500-41.7%$29/sqft |
Source: Public Record Report a problem | ||
| 12/20/2018 | Price change | $78,000+143.8%$50/sqft |
Source: Bay View Realty #MDBA302726 Report a problem | ||
| 12/19/2018 | Listed for sale | $32,000-59.6%$20/sqft |
Source: Bay View Realty #P112A2A Report a problem | ||
| 11/15/2018 | Sold | $79,136$51/sqft |
Source: Public Record Report a problem | ||
| Year | Property taxes | Tax assessment |
|---|---|---|
| 2025 | -- | $126,200 +22% |
| 2024 | $2,442 +28.2% | $103,467 +28.2% |
| 2023 | $1,905 +39.2% | $80,733 +39.2% |
| 2022 | $1,369 -33.2% | $58,000 -33.2% |
| 2021 | $2,048 +19.9% | $86,800 +19.9% |
| 2020 | $1,709 -33.4% | $72,400 -33.4% |
| 2019 | $2,565 | $108,700 |
| 2018 | $2,565 | $108,700 |
| 2017 | $2,565 +57.5% | $108,700 -1.8% |
| 2016 | $1,629 | $110,700 +7.4% |
| 2015 | $1,629 | $103,100 +8% |
| 2014 | $1,629 | $95,500 +8.6% |
| 2013 | -- | $87,900 +1.4% |
| 2012 | -- | $86,717 +1.4% |
| 2011 | -- | $85,533 +1.4% |
| 2010 | -- | $84,350 +7.2% |
| 2009 | -- | $78,710 +7.7% |
| 2008 | -- | $73,070 +8.4% |
| 2007 | -- | $67,430 +5.7% |
| 2006 | -- | $63,822 +6% |
| 2005 | -- | $60,216 +6.4% |
| 2004 | -- | $56,610 +0% |
| 2003 | -- | $56,592 +0% |
| 2002 | -- | $56,576 +0% |
| 2001 | -- | $56,560 |
Find assessor info on the county website
Source: Bright MLS. This data may not be complete. We recommend contacting the local school district to confirm school assignments for this home.
A local agent can set up tours, give advice and negotiate with sellers.