Great option for investors or first-time homebuyers! This 2-bedroom, 1-bath home offers potential for a rental property or an affordable place to call your own. Whether you’re looking to expand your portfolio or take the first step toward homeownership, 2841 S 13th is worth a look!
For sale
$65,000
2841 S 13th St, Springfield, IL 62703
2beds
608sqft
Single Family Residence, Residential
Built in ----
3,080 Square Feet Lot
$64,700 Zestimate®
$107/sqft
$-- HOA
What's special
- 8 days
- 270
- 18
Zillow last checked:
Listing updated:
Listed by:
Logan Frazier Pref:217-416-3401,
The Real Estate Group, Inc.
Source: RMLS Alliance as distributed by MLS GRID,MLS#: CA1047384 Originating MLS: Capital Area Association of Realtors
Facts & features
Interior
Bedrooms & bathrooms
- Bedrooms: 2
- Bathrooms: 1
- Full bathrooms: 1
Bedroom 1
- Level: Main
- Dimensions: 12ft 2in x 9ft 0in
Bedroom 2
- Level: Main
- Dimensions: 11ft 3in x 8ft 1in
Kitchen
- Level: Main
- Dimensions: 13ft 3in x 11ft 2in
Living room
- Level: Main
- Dimensions: 14ft 8in x 11ft 7in
Main level
- Area: 608
Heating
- Forced Air
Cooling
- Central Air
Appliances
- Included: Dishwasher, Microwave, Range
Features
- Ceiling Fan(s)
- Basement: Crawl Space
Interior area
- Total structure area: 608
- Total interior livable area: 608 sqft
Property
Parking
- Parking features: Carport
- Has carport: Yes
Lot
- Size: 3,080 Square Feet
- Dimensions: 40 x 77
- Features: Level
Details
- Parcel number: 2210.0402035
Construction
Type & style
- Home type: SingleFamily
- Architectural style: Ranch
- Property subtype: Single Family Residence, Residential
Materials
- Aluminum Siding
- Roof: Shingle
Condition
- New construction: No
Utilities & green energy
- Sewer: Public Sewer
- Water: Public
Community & HOA
Community
- Subdivision: None
Location
- Region: Springfield
Financial & listing details
- Price per square foot: $107/sqft
- Tax assessed value: $53,358
- Annual tax amount: $1,373
- Date on market: 10/27/2026
Estimated market value
$64,700
$61,000 - $68,000
$1,053/mo
Price history
| Date | Event | Price |
|---|---|---|
| 10/27/2026 | Listed for sale | $65,000+85.7%$107/sqft |
Source:  RMLS Alliance as distributed by MLS GRID #CA1047384 Report a problem | ||
| 5/18/2018 | Sold | $35,000-12.3%$58/sqft |
Source: RMLS Alliance as distributed by MLS GRID #CA182188 Report a problem | ||
| 4/16/2018 | Listed for sale | $39,900+6.4%$66/sqft |
Source: Keller Williams Capital #182188 Report a problem | ||
| 12/30/2017 | Listing removed | $37,500$62/sqft |
Source: Keller Williams Capital #173941 Report a problem | ||
| 10/27/2017 | Price change | $37,500-2.6%$62/sqft |
Source: Keller Williams Bloomington #173941 Report a problem | ||
| 8/4/2017 | Listed for sale | $38,500-3.5%$63/sqft |
Source: Keller Williams Bloomington #173941 Report a problem | ||
| 5/8/2017 | Listing removed | $39,900$66/sqft |
Source: Prairie Property Solutions #170826 Report a problem | ||
| 3/24/2017 | Listed for sale | $39,900$66/sqft |
Source: Prairie Property Solutions #170826 Report a problem | ||
Public tax history
| Year | Property taxes | Tax assessment |
|---|---|---|
| 2025 | $1,374 +3.1% | $17,786 +7.5% |
| 2024 | $1,333 +2% | $16,545 +8% |
| 2023 | $1,307 +4.2% | $15,319 +5.7% |
| 2022 | $1,254 +3.3% | $14,497 +4.1% |
| 2021 | $1,214 +3.7% | $13,929 +1.1% |
| 2020 | $1,172 +7.4% | $13,778 +1.8% |
| 2019 | $1,091 | $13,538 +0.4% |
| 2018 | $1,091 +2.4% | $13,480 +1.6% |
| 2017 | $1,065 +3.2% | $13,273 +2.7% |
| 2016 | $1,032 +1.9% | $12,930 +2.3% |
| 2015 | $1,013 +1.7% | $12,638 +0.8% |
| 2014 | $995 +92.9% | $12,532 -1.1% |
| 2013 | $516 -1% | $12,666 -1.7% |
| 2012 | $521 +2.8% | $12,886 |
| 2011 | $507 +1.2% | $12,886 -0.3% |
| 2010 | $501 +3.6% | $12,929 +0.9% |
| 2009 | $484 -6.2% | $12,816 +3.2% |
| 2008 | $516 -1.1% | $12,420 +1.5% |
| 2007 | $522 +0.3% | $12,238 +1.6% |
| 2006 | $520 | $12,044 |
Find assessor info on the county website
Monthly payment
Est. payment
Payment breakdown
Explore the cost of this home by adjusting the details. Changes won't be saved.Climate risks
Neighborhood: 62703


Similar homes
- $63,2662 bd1 ba800 sqft822 S Martin Luther King Jr Dr, Springfield, IL 62703Active
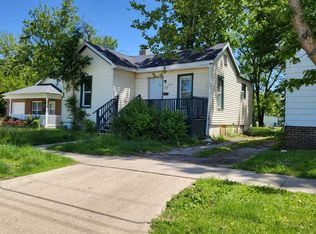 MLS ID #12645221, Juan Lozano, The Lozano Group. MRED as distributed by MLS GRID
- $56,9082 bd1 ba624 sqft1900 S 19th St, Springfield, IL 62703Active
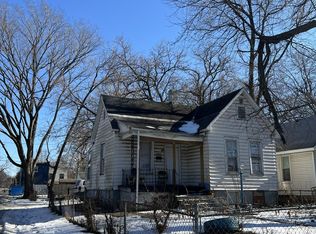 MLS ID #12645960, Juan Lozano, The Lozano Group. MRED as distributed by MLS GRID
- $56,5502 bd1 ba672 sqft1811 E Edwards St, Springfield, IL 62703Active
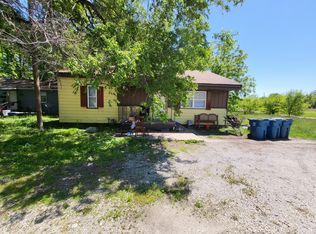 MLS ID #12645949, Juan Lozano, The Lozano Group. MRED as distributed by MLS GRID
- $39,9002 bd1 ba750 sqft2639 Poplar Ave, Springfield, IL 62703For Sale
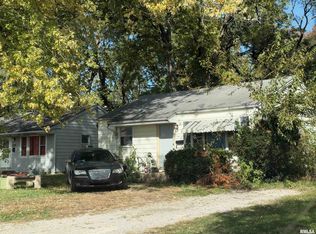
 MLS ID #CA1047428, Crystal Commean, RE/MAX Professionals. RMLS Alliance as distributed by MLS GRID
- $44,9001 bd1 ba676 sqft2449 S 13th St, Springfield, IL 62703For SaleMLS ID #CA1047437, John T McIntyre, Do Realty Services, Inc.. RMLS Alliance as distributed by MLS GRID
- $74,9002 bd1 ba804 sqft121 S Wesley St, Springfield, IL 62703For SaleMLS ID #CA1045297, Danielle Gipson, Keller Williams Capital. RMLS Alliance as distributed by MLS GRID
- $35,0002 bd1 ba728 sqft1929 South Grand Ave E, Springfield, IL 62703For SaleMLS ID #CA1046922, Crystal Commean, RE/MAX Professionals. RMLS Alliance as distributed by MLS GRID
- $57,7002 bd1 ba624 sqft600 N Stephens Ave, Springfield, IL 62702For SaleMLS ID #CA1046073, James J Skeeters, Keller Williams Capital. RMLS Alliance as distributed by MLS GRID
- $79,9003 bd1 ba792 sqft420 S 16th St, Springfield, IL 62703For SaleMLS ID #CA1045878, Beverly Christian, Beverly Christian Real Estate. RMLS Alliance as distributed by MLS GRID
- $49,9003 bd1 ba800 sqft1112 N Wesley St, Springfield, IL 62702For SaleMLS ID #CA1047429, Crystal Commean, RE/MAX Professionals. RMLS Alliance as distributed by MLS GRID
- $75,0001 bd1 ba624 sqft1604 N 32nd St, Springfield, IL 62702For SaleMLS ID #CA1047243, Kevin G Graham, Century 21 Real Estate Assoc. RMLS Alliance as distributed by MLS GRID
- $54,9002 bd1 ba812 sqft1164 N 3rd St, Springfield, IL 62702For SaleMLS ID #CA1045079, KC Sullivan, The Real Estate Group, Inc.. RMLS Alliance as distributed by MLS GRID
- $72,5002 bd2 ba872 sqft6600 6th Street Frontage Rd S, Springfield, IL 62712For SaleMLS ID #CA1047371, Joshua F Kruse, The Real Estate Group, Inc.. RMLS Alliance as distributed by MLS GRID
- $77,5002 bd1 ba704 sqft1624 N 28th St, Springfield, IL 62702For SaleMLS ID #CA1046739, Tracie Taylor, RE/MAX Professionals. RMLS Alliance as distributed by MLS GRID
- $89,5002 bd1 ba873 sqft1912 Whittier Ave, Springfield, IL 62704For SaleMLS ID #CA1046463, Andrew Kinney, The Real Estate Group, Inc.. RMLS Alliance as distributed by MLS GRID
- $34,9001 bd1 ba672 sqft207 S 1st St, Jeiseyville, IL 62568For SaleMLS ID #CA1047555, Joseph B Curvey, Curvey Real Estate, Inc.. RMLS Alliance as distributed by MLS GRID
- $33,0001 bd1 ba704 sqft1412 N 15th St, Springfield, IL 62702For SaleMLS ID #CA1043523, Jami R Winchester, The Real Estate Group, Inc.. RMLS Alliance as distributed by MLS GRID
