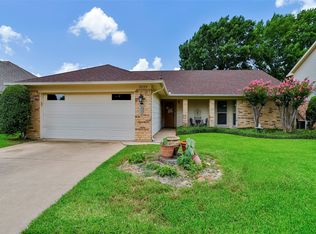
This 2123 square foot single family home has 3 bedrooms and 3.0 bathrooms. This home is located at 3233 Princess St, Bedford, TX 76021.
Foreclosed
Est. $419,700
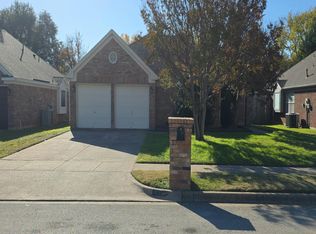
3233 Princess St, Bedford, TX 76021
3beds
2,123sqft
SingleFamily
Built in 1979
7,535 Square Feet Lot
$419,700 Zestimate®
$198/sqft
$-- HOA
Overview
- 164 days |
- 88 |
- 6 |
Facts & features
Interior
Bedrooms & bathrooms
- Bedrooms: 3
- Bathrooms: 3
- Full bathrooms: 3
Heating
- Forced air, Gas
Cooling
- Central
Features
- Flooring: Tile, Carpet, Laminate, Linoleum / Vinyl
- Has fireplace: Yes
Interior area
- Total interior livable area: 2,123 sqft
Property
Parking
- Total spaces: 2
- Parking features: Garage - Attached
Lot
- Size: 7,535 Square Feet
Details
- Parcel number: 03098451
Construction
Type & style
- Home type: SingleFamily
Materials
- Roof: Composition
Condition
- Year built: 1979
Community & HOA
Location
- Region: Bedford
Financial & listing details
- Price per square foot: $198/sqft
- Tax assessed value: $418,687
- Annual tax amount: $8,452
Visit our professional directory to find a foreclosure specialist in your area that can help with your home search.
Find a foreclosure agentForeclosure details
Estimated market value
$419,700
$399,000 - $441,000
$3,228/mo
Price history
Price history
| Date | Event | Price |
|---|---|---|
| 10/21/2025 | Sold | -- |
Source: Public Record Report a problem | ||
| 7/19/2025 | Price change | $425,000-2.3%$200/sqft |
Source: NTREIS #20943611 Report a problem | ||
| 6/10/2025 | Price change | $435,000-3.3%$205/sqft |
Source: NTREIS #20943611 Report a problem | ||
| 6/2/2025 | Listed for sale | $450,000+11.1%$212/sqft |
Source: NTREIS #20943611 Report a problem | ||
| 3/23/2022 | Sold | -- |
Source: NTREIS #14746292 Report a problem | ||
| 2/26/2022 | Pending sale | $405,000$191/sqft |
Source: NTREIS #14746292 Report a problem | ||
| 2/21/2022 | Contingent | $405,000$191/sqft |
Source: NTREIS #14746292 Report a problem | ||
| 2/21/2022 | Listed for sale | $405,000+62%$191/sqft |
Source: NTREIS #14746292 Report a problem | ||
| 5/17/2016 | Sold | -- |
Source: Agent Provided Report a problem | ||
| 4/11/2016 | Pending sale | $250,000$118/sqft |
Source: Keller Williams - Dallas Metro North #13344574 Report a problem | ||
| 4/5/2016 | Listed for sale | $250,000+43%$118/sqft |
Source: Keller Williams Realty-FM #13344574 Report a problem | ||
| 3/30/2010 | Sold | -- |
Source: Agent Provided Report a problem | ||
| 11/25/2009 | Price change | $174,850-2.8%$82/sqft |
Source: Century 21 Mike Bowman, Inc. #11213306 Report a problem | ||
| 9/15/2009 | Listed for sale | $179,8500%$85/sqft |
Source: Century 21 Mike Bowman, Inc. #11213306 Report a problem | ||
| 8/4/2009 | Listing removed | $179,900$85/sqft |
Source: Mike Bowman #11213306 Report a problem | ||
| 7/18/2009 | Price change | $179,900+0%$85/sqft |
Source: Mike Bowman #11213306 Report a problem | ||
| 7/13/2009 | Price change | $179,850-2.3%$85/sqft |
Source: Mike Bowman #11213306 Report a problem | ||
| 6/11/2009 | Listed for sale | $184,000$87/sqft |
Source: Century 21 #11213306 Report a problem | ||
Public tax history
Public tax history
| Year | Property taxes | Tax assessment |
|---|---|---|
| 2025 | $8,452 +3.7% | $418,687 |
| 2024 | $8,151 +20.1% | $418,687 +18.3% |
| 2023 | $6,788 +14.3% | $353,921 +4.6% |
| 2022 | $5,939 +2.3% | $338,225 +26.2% |
| 2021 | $5,806 -2.5% | $268,000 |
| 2020 | $5,954 -0.9% | $268,000 |
| 2019 | $6,006 +3.3% | $268,000 +5.1% |
| 2018 | $5,813 +5.8% | $255,000 +3.8% |
| 2017 | $5,495 +35.5% | $245,634 +15.9% |
| 2016 | $4,057 +3.3% | $211,892 +26.7% |
| 2015 | $3,926 | $167,300 |
| 2014 | $3,926 | $167,300 |
| 2013 | -- | $167,300 +0.4% |
| 2012 | -- | $166,700 |
| 2011 | -- | $166,700 +3.9% |
| 2010 | -- | $160,400 +3.7% |
| 2009 | -- | $154,700 -2% |
| 2008 | -- | $157,800 |
| 2007 | -- | $157,800 |
| 2006 | -- | $157,800 |
| 2005 | -- | $157,800 |
| 2004 | -- | $157,800 +10.2% |
| 2003 | -- | $143,200 +3% |
| 2002 | -- | $139,000 +5.1% |
| 2001 | -- | $132,200 +18.1% |
| 2000 | -- | $111,900 |
Find assessor info on the county website
Monthly payment
Estimated monthly payment
All calculations are estimates and provided by Zillow, Inc. for informational purposes only. Actual amounts may vary.
HOA fees may include property taxes on listings classified as Co-Ops. Contact the listing agent and/or owner for fee details.
Mortgage interest rates are dependent on a number of factors, including credit score, down payment, and repayment length. Interest rate data provided by Zillow Group Marketplace, Inc. as of 1/1/1970 from various mortgage lenders with which we have lead or other similar arrangements; the Estimated Payment is an average of those rates.
See how much you could borrow to make a competitive offer.
Climate risks
Neighborhood: Teakwood Estates
Nearby schools
GreatSchools rating
- 8/10Meadow Creek Elementary SchoolGrades: PK-6Distance: 0.4 mi
- 9/10Harwood Junior High SchoolGrades: 7-9Distance: 0.2 mi
- 6/10Trinity High SchoolGrades: 10-12Distance: 1.5 mi
Schools provided by the listing agent
- Elementary: Meadowcrk
- High: Trinity
Source: The MLS. This data may not be complete. We recommend contacting the local school district to confirm school assignments for this home.
- Texas
- Tarrant County
- Bedford
- 76021
- Teakwood Estates
- 3233 Princess St
Nearby cities
Nearby neighborhoods
Nearby zip codes
Other Bedford Topics
