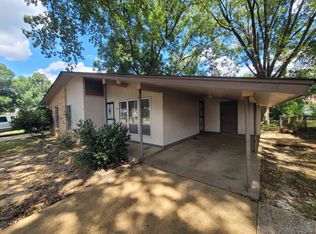
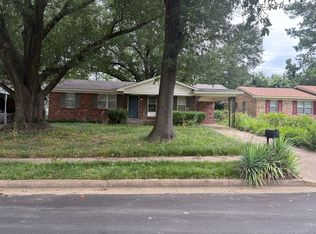
Price Improvement! Cash flowing property for sale with long term tenant in place! Home is located in desirable South Memphis neighborhood. Tenant pays $1090 and lease ends October 2027. Home professionally managed with all ledger and maintenance records available upon request. HVAC and HWH 2021 and roof 10 years old. Call listing agent for details. Access upon accepted offer. Do not disturb tenants.
For sale
Price cut: $3K (10/19)
$113,900
3127 Knightway Rd, Memphis, TN 38118
3beds
920sqft
Single Family Residence
Built in 1959
8,276 Square Feet Lot
$111,700 Zestimate®
$124/sqft
$-- HOA
What's special
- 24 days
- 114
- 11
Likely to sell faster than
Zillow last checked:
Listing updated:
Listed by:
Andrew Akins,
CB Properties of Memphis, LLC 901-620-6787
Source: MAAR,MLS#: 10231113
Facts & features
Interior
Bedrooms & bathrooms
- Bedrooms: 3
- Bathrooms: 1
- Full bathrooms: 1
Primary bedroom
- Area: 224
- Dimensions: 16 x 14
Dining room
- Dimensions: 0 x 0
Living room
- Area: 192
- Dimensions: 16 x 12
Den
- Dimensions: 0 x 0
Heating
- Central
Cooling
- Central Air
Features
- All Bedrooms Down, Square Feet Source: AutoFill (MAARdata) or Public Records (Cnty Assessor Site)
- Has fireplace: No
Interior area
- Total interior livable area: 920 sqft
Property
Parking
- Parking features: Driveway/Pad
- Has uncovered spaces: Yes
Features
- Stories: 1
- Patio & porch: Porch
- Pool features: None
Lot
- Size: 8,276 Square Feet
- Dimensions: 60 x 143
- Features: Level
Details
- Parcel number: 073063 00031
Construction
Type & style
- Home type: SingleFamily
- Architectural style: Traditional
- Property subtype: Single Family Residence
Materials
- Brick Veneer
Condition
- New construction: No
- Year built: 1959
Community & HOA
Community
- Subdivision: Knight Knoll Blk A
Location
- Region: Memphis
Financial & listing details
- Price per square foot: $124/sqft
- Tax assessed value: $126,900
- Annual tax amount: $1,672
- Price range: $113.9K - $113.9K
- Date on market: 9/25/2026
- Cumulative days on market: 25 days
Estimated market value
$111,700
$106,000 - $117,000
$1,126/mo
Price history
| Date | Event | Price |
|---|---|---|
| 10/19/2026 | Price change | $113,900-2.6%$124/sqft |
Source:  MAAR #10231113 Report a problem | ||
| 9/25/2026 | Listed for sale | $116,900-14%$127/sqft |
Source: MAAR #10231113 Report a problem | ||
| 12/22/2023 | Sold | $135,900+3%$148/sqft |
Source: MAAR #10156783 Report a problem | ||
| 11/9/2023 | Pending sale | $131,900$143/sqft |
Source: MAAR #10156783 Report a problem | ||
| 10/25/2023 | Listing removed | -- |
Source: Zillow Rentals Report a problem | ||
| 10/16/2023 | Price change | $985-3.9%$1/sqft |
Source: Zillow Rentals Report a problem | ||
| 10/13/2023 | Listing removed | -- |
Source: MAAR #10156783 Report a problem | ||
| 10/12/2023 | Price change | $1,025-2.8%$1/sqft |
Source: Zillow Rentals Report a problem | ||
| 9/15/2023 | Listed for sale | $131,900-3.7%$143/sqft |
Source: MAAR #10156783 Report a problem | ||
| 9/6/2023 | Price change | $1,055-0.5%$1/sqft |
Source: Zillow Rentals Report a problem | ||
| 9/3/2023 | Listing removed | -- |
Source: MAAR #10149226 Report a problem | ||
| 7/15/2023 | Price change | $1,060-3.2%$1/sqft |
Source: Zillow Rentals Report a problem | ||
| 6/14/2023 | Price change | $1,095+4.3%$1/sqft |
Source: Zillow Rentals Report a problem | ||
| 6/8/2023 | Listed for sale | $136,900$149/sqft |
Source: MAAR #10149226 Report a problem | ||
| 6/5/2023 | Pending sale | $136,900$149/sqft |
Source: MAAR #10149226 Report a problem | ||
| 6/2/2023 | Listed for sale | $136,900+53.8%$149/sqft |
Source: MAAR #10149226 Report a problem | ||
| 5/30/2023 | Listed for rent | $1,050+32.1%$1/sqft |
Source: Zillow Rentals Report a problem | ||
| 5/1/2023 | Sold | $89,000-19.1%$97/sqft |
Source: MAAR #10138860 Report a problem | ||
| 4/21/2023 | Contingent | $110,000$120/sqft |
Source: MAAR #10138860 Report a problem | ||
| 4/14/2023 | Listed for sale | $110,000$120/sqft |
Source: MAAR #10138860 Report a problem | ||
| 12/27/2022 | Contingent | $110,000$120/sqft |
Source: MAAR #10138860 Report a problem | ||
| 12/8/2022 | Listed for sale | $110,000+144.4%$120/sqft |
Source: MAAR #10138860 Report a problem | ||
| 10/5/2019 | Listing removed | $795$1/sqft |
Source: PMI of Memphis Report a problem | ||
| 9/24/2019 | Price change | $795-6.5%$1/sqft |
Source: Zillow Rental Network Report a problem | ||
| 9/20/2019 | Listed for rent | $850$1/sqft |
Source: Zillow Rental Network Report a problem | ||
| 1/4/2011 | Sold | $45,000-7.6%$49/sqft |
Source: Public Record Report a problem | ||
| 9/10/2010 | Sold | $48,697-20.2%$53/sqft |
Source: Public Record Report a problem | ||
| 5/9/2008 | Sold | $61,000+206.5%$66/sqft |
Source: Public Record Report a problem | ||
| 3/25/2004 | Sold | $19,901-61.7%$22/sqft |
Source: Public Record Report a problem | ||
| 7/25/1997 | Sold | $52,000$57/sqft |
Source: Public Record Report a problem | ||
Public tax history
| Year | Property taxes | Tax assessment |
|---|---|---|
| 2025 | $1,672 +25.1% | $31,725 +56.3% |
| 2024 | $1,337 +53.5% | $20,300 +42% |
| 2023 | $871 | $14,300 |
| 2022 | -- | $14,300 |
| 2021 | -- | $14,300 +29.7% |
| 2020 | $352 | $11,025 |
| 2019 | $352 -21.1% | $11,025 |
| 2018 | $447 -45.1% | $11,025 |
| 2017 | $814 +123.7% | $11,025 +3% |
| 2016 | $364 -12.6% | $10,700 |
| 2014 | $416 | $10,700 |
| 2013 | -- | $10,700 -18% |
| 2012 | -- | $13,050 |
| 2011 | -- | $13,050 |
| 2010 | -- | $13,050 |
| 2009 | -- | $13,050 -7.8% |
| 2008 | -- | $14,150 |
| 2007 | -- | $14,150 |
| 2006 | -- | $14,150 |
| 2005 | -- | $14,150 +7.6% |
| 2004 | -- | $13,150 |
| 2003 | -- | $13,150 |
| 2002 | -- | $13,150 |
| 2001 | -- | $13,150 +7.1% |
| 2000 | -- | $12,275 |
Find assessor info on the county website
Monthly payment
Est. payment
Payment breakdown
Explore the cost of this home by adjusting the details. Changes won't be saved.Climate risks
Neighborhood: Parkway Village-Oakhaven

Similar homes
- $--3 bd2 ba1.2k sqft4268 Knight Arnold Rd, Memphis, TN 38118AuctionAuction.com 2
- $114,9003 bd2 ba1.3k sqft2968 Brandale St, Memphis, TN 38118For Sale
 MLS ID #10232087, Michelle Woodland-Lidster, Mainstay Brokerage, LLC. MAAR
- $115,0003 bd2 ba1k sqft2988 Danville Rd, Memphis, TN 38118For Sale
 MLS ID #10228206, Jay W McMiller, Bespoke Realty. MAAR
- $--3 bd2 ba1.2k sqft2988 Capri Rd, Memphis, TN 38118Auction
 ServiceLink Auction
