Enjoy the appeal of country living with this 3-bedroom, 2-bath home situated on approximately 0.6 acres in a rural setting. The open-concept floor plan connects the living and kitchen areas, creating a functional and comfortable living space. Step outside to enjoy the spacious yard and back deck, offering additional outdoor space for relaxing and entertaining. With its combination of an open interior layout, outdoor living space, and country setting, this property offers an opportunity to enjoy a more rural lifestyle. Schedule your showing today!
For sale
$216,900
316 Wet Cat Rd, Hayden, AL 35079
3beds
1,354sqft
Single Family Residence
Built in 2008
0.6 Acres Lot
$-- Zestimate®
$160/sqft
$-- HOA
What's special
Back deckSpacious yardOpen-concept floor plan
- 17 days
- 679
- 89
Zillow last checked:
Listing updated:
Listed by:
Jill Lambert 256-339-4152,
EXIT Lake & Country Real Estate
Source: Strategic MLS Alliance,MLS#: 532097
Facts & features
Interior
Bedrooms & bathrooms
- Bedrooms: 3
- Bathrooms: 2
- Full bathrooms: 2
- Main level bedrooms: 3
Basement
- Area: 0
Features
- Has basement: No
- Has fireplace: No
Interior area
- Total structure area: 1,354
- Total interior livable area: 1,354 sqft
- Finished area above ground: 1,354
- Finished area below ground: 0
Property
Features
- Frontage length: 114
Lot
- Size: 0.6 Acres
- Dimensions: 114 x 263 x 134 x 237
Details
- Parcel number: 1404200000006.036
Construction
Type & style
- Home type: SingleFamily
- Property subtype: Single Family Residence
Condition
- Year built: 2008
Utilities & green energy
- Sewer: Septic Tank
Community & HOA
HOA
- Has HOA: No
Location
- Region: Hayden
Financial & listing details
- Price per square foot: $160/sqft
- Tax assessed value: $178,860
- Annual tax amount: $546
- Price range: $216.9K - $216.9K
- Date on market: 11/2/2026
Estimated market value
Not available
Estimated sales range
Not available
Not available
Price history
| Date | Event | Price |
|---|---|---|
| 11/2/2026 | Listed for sale | $216,900+9.4%$160/sqft |
Source: Strategic MLS Alliance #532097 Report a problem | ||
| 2/28/2024 | Sold | $198,300-0.8%$146/sqft |
Source: Strategic MLS Alliance #514086 Report a problem | ||
| 1/23/2024 | Pending sale | $199,900$148/sqft |
Source:  GALMLS #21371835 Report a problem | ||
| 12/2/2023 | Listed for sale | $199,900+30.7%$148/sqft |
Source: GALMLS #21371835 Report a problem | ||
| 5/20/2021 | Sold | $153,000+2.1%$113/sqft |
Source: GALMLS #1280476 Report a problem | ||
| 4/8/2021 | Contingent | $149,900$111/sqft |
Source: GALMLS #1280476 Report a problem | ||
| 4/5/2021 | Listed for sale | $149,900$111/sqft |
Source: GALMLS #1280476 Report a problem | ||
| 3/30/2021 | Contingent | $149,900$111/sqft |
Source: GALMLS #1280476 Report a problem | ||
| 3/29/2021 | Listed for sale | $149,900+23.4%$111/sqft |
Source: GALMLS #1280476 Report a problem | ||
| 8/3/2018 | Sold | $121,500-0.4%$90/sqft |
Source: GALMLS #821778 Report a problem | ||
| 7/12/2018 | Price change | $122,000+6.1%$90/sqft |
Source: Sweet Homelife Oneonta #821778 Report a problem | ||
| 7/7/2018 | Pending sale | $115,000$85/sqft |
Source: Sweet Homelife Oneonta #821778 Report a problem | ||
| 7/3/2018 | Listed for sale | $115,000+46.5%$85/sqft |
Source: Sweet Homelife Oneonta #821778 Report a problem | ||
| 6/5/2013 | Sold | $78,500$58/sqft |
Source: Public Record Report a problem | ||
| 2/17/2013 | Listing removed | $78,500$58/sqft |
Source: Retopia Report a problem | ||
| 1/24/2013 | Price change | $78,500-9.7%$58/sqft |
Source: Retopia Report a problem | ||
| 9/25/2012 | Price change | $86,900-2.9%$64/sqft |
Source: Retopia Report a problem | ||
| 9/4/2012 | Listed for sale | $89,500-5.7%$66/sqft |
Source: Retopia Report a problem | ||
| 7/7/2012 | Listing removed | $94,900$70/sqft |
Source: Retopia Report a problem | ||
| 6/19/2012 | Price change | $94,900-12.5%$70/sqft |
Source: Retopia Report a problem | ||
| 5/24/2012 | Listed for sale | $108,500-7.6%$80/sqft |
Source: Retopia Report a problem | ||
| 1/2/2008 | Sold | $117,400$87/sqft |
Source: Public Record Report a problem | ||
Public tax history
| Year | Property taxes | Tax assessment |
|---|---|---|
| 2026 | $581 +6.4% | $17,880 +6.4% |
| 2025 | $546 +16.1% | $16,800 +3.3% |
| 2024 | $470 +17.7% | $16,260 +15.5% |
| 2023 | $400 +16.5% | $14,080 +14.1% |
| 2022 | $343 | $12,340 +14.9% |
| 2021 | -- | $10,740 +0.4% |
| 2020 | $290 +4.5% | $10,700 +3.7% |
| 2019 | $277 +7.3% | $10,320 +6% |
| 2018 | $259 | $9,740 -1.4% |
| 2017 | $259 -1.7% | $9,880 |
| 2015 | $263 -4% | $9,880 -3.3% |
| 2014 | $274 | $10,220 -50.6% |
| 2013 | $274 | $20,680 +3% |
| 2012 | -- | $20,080 +94.2% |
| 2011 | -- | $10,340 -3.5% |
| 2010 | -- | $10,720 |
Find assessor info on the county website
Monthly payment
Est. payment
Payment breakdown
Explore the cost of this home by adjusting the details. Changes won't be saved.Climate risks
Neighborhood: 35079
Nearby schools
Similar homes
- $214,9003 bd2 ba1.2k sqft95 Summit Dr, Hayden, AL 35079For Sale
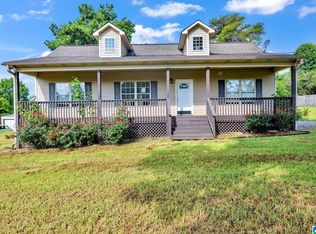
 MLS ID #21464088, Janet Railey, Essential Real Estate-Madison. GALMLS
- $214,9003 bd2 ba1.3k sqftAt&t Air, Hayden, AL 35079For Sale
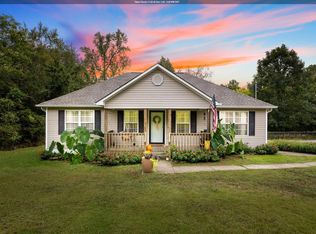 MLS ID #21466295, Toni Deegan, Your Home Sold Guaranteed Real. GALMLS
- $230,0003 bd2 ba1.4k sqft2989 Graves Gap Rd, Hayden, AL 35079For Sale
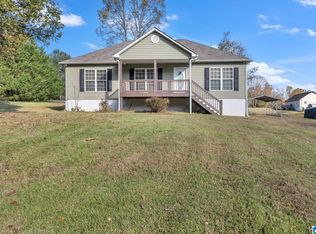 MLS ID #21470108, Renee McAdams, ERA King Real Estate. GALMLS
- $229,9003 bd2 ba1.3k sqft929 Holt Cir, Hayden, AL 35079For Sale
 MLS ID #21468131, Darren White, White Real Estate Inc.. GALMLS
- $229,0003 bd2 ba1.6k sqft45 Standridge Dr, Hayden, AL 35079For SaleMLS ID #21468322, Karen Kilgore, EXP Realty LLC. GALMLS
- $210,0003 bd2 ba1.2k sqft97 Edgewood Rd, Cleveland, AL 35049For SaleMLS ID #21465996, Tony McDaniels, eXp Realty, LLC Central. GALMLS
- $215,0003 bd2 ba1.2k sqft340 Blossum Ln, Blountsville, AL 35031For SaleMLS ID #21469658, Kayla Quinn, RE/MAX on Main. GALMLS
- $214,9004 bd2 ba1.3k sqft115 Sunny Meadows Dr, Locust Fork, AL 35097For SaleMLS ID #21466234, Whitney Houser, RE/MAX Realty Brokers. GALMLS
- $215,0003 bd2 ba1.2k sqft183 Fowler Springs Rd, Blountsville, AL 35031For SaleMLS ID #21461095, Julia Hubbard, EXIT Legacy Realty. GALMLS
- $200,0003 bd1 ba1.5k sqftGonetspeed, Cleveland, AL 35049For SaleMLS ID #21467529, Monica Moorer, HomeRiver Group, LLC. GALMLS
- $209,9003 bd2 ba1.3k sqft81 Honeycutt Rd, Remlap, AL 35133For SaleMLS ID #21465018, Anita Woods, RealtySouth-Northern Office. GALMLS
