Attention Investors or home buyers who want cheap living! This 2 bedroom, 1 bathroom can be added to your rental portfolio or make it your home. Unfinished basement. Sold As Is.
Pending
$49,900
324 W Ridge Rd, Gary, IN 46408
2beds
616sqft
Single Family Residence
Built in 1922
3,136 Square Feet Lot
$-- Zestimate®
$81/sqft
$-- HOA
What's special
- 21 days
- 363
- 45
Likely to sell faster than
Zillow last checked:
Listing updated:
Listed by:
Laurene Lemanski,
Briar Executive Realty 708-351-6898
Source: NIRA as distributed by MLS GRID,MLS#: 847413
Facts & features
Interior
Bedrooms & bathrooms
- Bedrooms: 2
- Bathrooms: 1
- Full bathrooms: 1
Primary bedroom
- Level: Main
- Area: 100
- Dimensions: 10.0 x 10.0
Bedroom 2
- Level: Main
- Area: 90
- Dimensions: 10.0 x 9.0
Kitchen
- Level: Main
- Area: 72
- Dimensions: 9.0 x 8.0
Living room
- Level: Main
- Area: 110
- Dimensions: 11.0 x 10.0
Heating
- Forced Air
Appliances
- Included: None
Features
- Eat-in Kitchen
- Basement: Full,Unfinished
- Has fireplace: No
Interior area
- Total structure area: 616
- Total interior livable area: 616 sqft
- Finished area above ground: 616
Property
Parking
- Parking features: On Street
Features
- Levels: One
- Has view: Yes
- View description: Neighborhood
Lot
- Size: 3,136 Square Feet
- Features: Back Yard
Details
- Parcel number: 450828226029000004
- Special conditions: None
Construction
Type & style
- Home type: SingleFamily
- Property subtype: Single Family Residence
Condition
- New construction: No
- Year built: 1922
Utilities & green energy
- Sewer: Public Sewer
- Water: Public
- Utilities for property: Electricity Connected, Water Connected, Sewer Connected, Natural Gas Connected
Community & HOA
Community
- Subdivision: Jackson Park South Broadway Add
HOA
- Has HOA: No
Location
- Region: Gary
Financial & listing details
- Price per square foot: $81/sqft
- Tax assessed value: $52,400
- Annual tax amount: $823
- Date on market: 10/27/2026
- Listing agreement: Exclusive Agency
- Listing terms: Cash,Conventional
Estimated market value
Not available
Estimated sales range
Not available
$1,012/mo
Price history
| Date | Event | Price |
|---|---|---|
| 11/16/2026 | Pending sale | $49,900$81/sqft |
Source:  NIRA as distributed by MLS GRID #847413 Report a problem | ||
| 10/27/2026 | Listed for sale | $49,900+193.5%$81/sqft |
Source: NIRA as distributed by MLS GRID #847413 Report a problem | ||
| 9/13/2024 | Listing removed | $895$1/sqft |
Source: Zillow Rentals Report a problem | ||
| 7/20/2024 | Listed for rent | $895+62.7%$1/sqft |
Source: Zillow Rentals Report a problem | ||
| 2/29/2020 | Listing removed | $550$1/sqft |
Source: Zillow Rental Network Report a problem | ||
| 1/11/2020 | Price change | $550-7.6%$1/sqft |
Source: Zillow Rental Network Report a problem | ||
| 12/14/2019 | Price change | $595-4.8%$1/sqft |
Source: Zillow Rental Network Report a problem | ||
| 12/6/2019 | Listed for rent | $625$1/sqft |
Source: Zillow Rental Network Report a problem | ||
| 5/23/2019 | Listing removed | $625$1/sqft |
Source: Zillow Rental Network Report a problem | ||
| 4/20/2019 | Listed for rent | $625+5%$1/sqft |
Source: Zillow Rental Network Report a problem | ||
| 3/31/2017 | Listing removed | $595$1/sqft |
Source: REIBlackBook Report a problem | ||
| 3/3/2017 | Listed for rent | $595+8.2%$1/sqft |
Source: REIBlackBook Report a problem | ||
| 9/25/2015 | Listing removed | $550$1/sqft |
Source: REIBlackBook Report a problem | ||
| 7/25/2015 | Price change | $550-2.7%$1/sqft |
Source: REIBlackBook Report a problem | ||
| 7/16/2015 | Listed for rent | $565$1/sqft |
Source: REIBlackBook Report a problem | ||
| 4/12/2007 | Sold | $17,000$28/sqft |
Source: NIRA as distributed by MLS GRID #179300 Report a problem | ||
Public tax history
| Year | Property taxes | Tax assessment |
|---|---|---|
| 2025 | $823 +7.3% | $52,400 +59.8% |
| 2024 | $767 +4.6% | $32,800 +7.9% |
| 2023 | $733 +8.3% | $30,400 +6.3% |
| 2022 | $676 +5.2% | $28,600 +8.3% |
| 2021 | $643 +28.1% | $26,400 +5.2% |
| 2020 | $502 -21.3% | $25,100 |
| 2019 | $638 +23.6% | $25,100 |
| 2018 | $516 +23% | $25,100 +32.1% |
| 2017 | $419 | $19,000 -3.6% |
| 2016 | $419 -9.5% | $19,700 -0.5% |
| 2014 | $463 +6.8% | $19,800 +2.6% |
| 2013 | $434 -3.2% | $19,300 |
| 2012 | $448 +66.8% | $19,300 +72.3% |
| 2011 | $269 -4% | $11,200 |
| 2010 | $280 | $11,200 |
| 2009 | -- | $11,200 +10.9% |
| 2007 | -- | $10,100 +124.4% |
| 2006 | -- | $4,500 |
| 2005 | -- | $4,500 |
| 2004 | -- | $4,500 -36.6% |
| 2003 | -- | $7,100 |
| 2002 | -- | $7,100 +199.6% |
| 2001 | -- | $2,370 |
Find assessor info on the county website
Monthly payment
Est. payment
Payment breakdown
Explore the cost of this home by adjusting the details. Changes won't be saved.Climate risks
Neighborhood: University Park


Similar homes
- $45,0002 bd1 ba684 sqft4455 Madison St, Gary, IN 46408For Sale
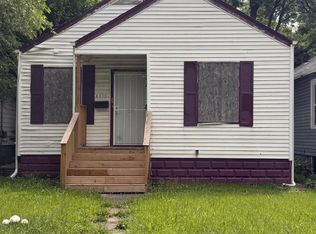
 MLS ID #841107, Frederick Long, Better Homes and Gardens Real. NIRA as distributed by MLS GRID
- $59,9002 bd1 ba728 sqft700 W 45th Ave, Gary, IN 46408For Sale
 MLS ID #847737, Steven Koleno, Beycome Brokerage Realty LLC. NIRA as distributed by MLS GRID
- $49,9002 bd3 ba680 sqft2517 Lincoln St, Gary, IN 46407For Sale
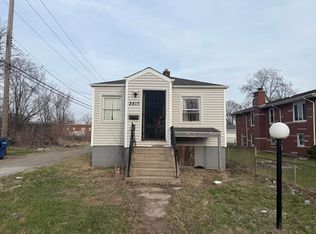 MLS ID #846265, Craig Frendling, Advanced Real Estate, LLC. NIRA as distributed by MLS GRID
- $57,5002 bd2 ba777 sqft1043 Benton St, Gary, IN 46403For Sale
 MLS ID #847728, Susan Beyler, Harbor & Lake Real Estate, LLC. NIRA as distributed by MLS GRID
- $29,9002 bd1 ba716 sqft4188 Georgia St, Gary, IN 46409For SaleMLS ID #847978, Carmen Howard, Howard Realty Group, LLC. NIRA as distributed by MLS GRID
- $37,0002 bd1 ba844 sqft2037 Delaware St, Gary, IN 46407For SaleMLS ID #843884, Carmen Howard, Howard Realty Group, LLC. NIRA as distributed by MLS GRID
- $25,0002 bd1 ba625 sqft3401 Vermont St, Gary, IN 46409For SaleMLS ID #840211, Luke Mitchell, Legacy Realty Group LLC. NIRA as distributed by MLS GRID
- $26,9993 bd1 ba858 sqft1105 W 15th Ave, Gary, IN 46407For SaleMLS ID #834544, Angelo Pedroza, Estate Squared Away. NIRA as distributed by MLS GRID
- $70,0003 bd1 ba864 sqft3120 W 22nd Ave, Gary, IN 46404For SaleMLS ID #842267, Sachet White, Century 21 Impact. NIRA as distributed by MLS GRID
- $69,9003 bd2 ba864 sqft1341 Taney St, Gary, IN 46404For SaleMLS ID #843058, John Sandridge, Eagle Pro Realty. NIRA as distributed by MLS GRID
- $30,0002 bd1 ba868 sqft322 Clark Rd, Gary, IN 46406For SaleMLS ID #846573, Dierdra Shittu, @properties/Christie's Intl RE. NIRA as distributed by MLS GRID
- $69,9003 bd1 ba875 sqft3321 W 11th Ave, Gary, IN 46404For SaleMLS ID #843061, John Sandridge, Eagle Pro Realty. NIRA as distributed by MLS GRID
