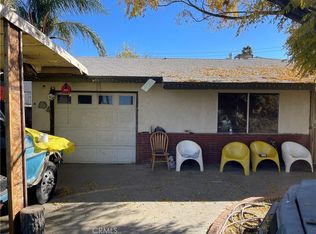
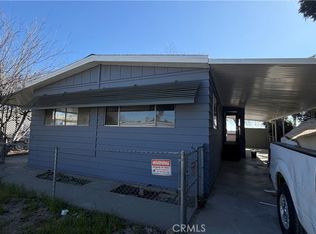
MANUFACTURED HOME ON IT'S OWN LAND AND IS ZONED R3. CLOSE TO THE LAKE. NEEDS SOME TLC. PRICED TO SELL. COMPLETLY FENCED WITH A CARPORT.RV ACCESS
Foreclosed
Street View
Est. $400,033
33056 Garner Rd, Lake Elsinore, CA 92530
2beds
960sqft
MobileManufactured
Built in 1991
6,534 Square Feet Lot
$-- Zestimate®
$417/sqft
$-- HOA
Overview
- 84 days |
- 797 |
- 32 |
Facts & features
Interior
Bedrooms & bathrooms
- Bedrooms: 2
- Bathrooms: 2
- Full bathrooms: 2
Heating
- Forced air
Cooling
- Central
Appliances
- Included: Dishwasher, Garbage disposal, Range / Oven
Features
- Basement: None
- Has fireplace: No
Interior area
- Total interior livable area: 960 sqft
Property
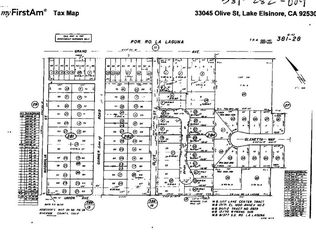
Lot
- Size: 6,534 Square Feet
Details
- Parcel number: 381282033
Construction
Type & style
- Home type: MobileManufactured
Materials
- Roof: Other
Condition
- Year built: 1991
Community & HOA
Location
- Region: Lake Elsinore
Financial & listing details
- Price per square foot: $417/sqft
- Tax assessed value: $400,033
- Annual tax amount: $4,239
Visit our professional directory to find a foreclosure specialist in your area that can help with your home search.
Find a foreclosure agentForeclosure details
Estimated market value
Not available
Estimated sales range
Not available
$2,110/mo
Price history
| Date | Event | Price |
|---|---|---|
| 4/10/2026 | Listing removed | $385,000+21.6%$401/sqft |
Source: | ||
| 3/19/2026 | Sold | $316,520-24.6%$330/sqft |
Source: Public Record Report a problem | ||
| 7/22/2025 | Listing removed | $420,000$438/sqft |
Source: | ||
| 6/30/2025 | Listed for sale | $420,000+9.2%$438/sqft |
Source: | ||
| 7/8/2022 | Sold | $384,500$401/sqft |
Source: Public Record Report a problem | ||
| 6/16/2022 | Pending sale | $384,500$401/sqft |
Source: | ||
| 6/4/2022 | Price change | $384,500-0.1%$401/sqft |
Source: | ||
| 5/19/2022 | Listed for sale | $385,000$401/sqft |
Source: | ||
| 5/16/2022 | Pending sale | $385,000$401/sqft |
Source: | ||
| 5/3/2022 | Price change | $385,000-2.5%$401/sqft |
Source: | ||
| 4/18/2022 | Price change | $395,000+7.1%$411/sqft |
Source: | ||
| 3/21/2022 | Pending sale | $368,880$384/sqft |
Source: | ||
| 3/16/2022 | Listed for sale | $368,880+56.3%$384/sqft |
Source: | ||
| 1/25/2022 | Sold | $236,000+58.4%$246/sqft |
Source: Public Record Report a problem | ||
| 9/1/2015 | Sold | $149,000+41.9%$155/sqft |
Source: Public Record Report a problem | ||
| 6/4/2015 | Sold | $105,000-8.7%$109/sqft |
Source: Public Record Report a problem | ||
| 5/9/2015 | Pending sale | $115,000$120/sqft |
Source: CENTURY 21 Experience #CV14219457 Report a problem | ||
| 10/14/2014 | Listed for sale | $115,000-11.5%$120/sqft |
Source: CENTURY 21 Experience #CV14219457 Report a problem | ||
| 8/21/2003 | Sold | $130,000$135/sqft |
Source: Public Record Report a problem | ||
Public tax history
| Year | Property taxes | Tax assessment |
|---|---|---|
| 2025 | $4,239 +4.7% | $400,033 +2% |
| 2024 | $4,047 +1.3% | $392,190 +2% |
| 2023 | $3,995 +140.4% | $384,500 +131.3% |
| 2022 | $1,661 +2.1% | $166,207 +2% |
| 2021 | $1,628 +1.1% | $162,949 +1% |
| 2020 | $1,610 +2.1% | $161,279 +2% |
| 2019 | $1,578 +2.1% | $158,118 +2% |
| 2018 | $1,546 +2.1% | $155,018 +2% |
| 2017 | $1,514 | $151,980 +2% |
| 2016 | $1,514 +82.2% | $149,000 +71.3% |
| 2015 | $831 +1% | $87,000 |
| 2014 | $823 | $87,000 +52.6% |
| 2013 | -- | $57,000 +1.8% |
| 2012 | -- | $56,000 +11.9% |
| 2011 | -- | $50,050 |
| 2010 | -- | $50,050 -35% |
| 2009 | -- | $77,000 -60.1% |
| 2008 | -- | $193,000 +51.6% |
| 2007 | -- | $127,344 +2% |
| 2006 | -- | $124,848 +2% |
| 2005 | -- | $122,400 +381.9% |
| 2003 | -- | $25,400 +520.9% |
| 2002 | -- | $4,091 +2% |
| 2001 | $70 +1.1% | $4,011 +2% |
| 2000 | $69 | $3,933 |
Find assessor info on the county website
Monthly payment
Estimated monthly payment$1,822
All calculations are estimates and provided by Zillow, Inc. for informational purposes only. Actual amounts may vary.
HOA fees may include property taxes on listings classified as Co-Ops. Contact the listing agent and/or owner for fee details.
Mortgage interest rates are dependent on a number of factors, including credit score, down payment, and repayment length. Interest rate data provided by Zillow Group Marketplace, Inc. as of 1/1/1970 from various mortgage lenders with which we have lead or other similar arrangements; the Estimated Payment is an average of those rates.
See how much you could borrow to make a competitive offer.
Climate risks
Neighborhood: 92530
Nearby schools
GreatSchools rating
- 2/10Lakeland Village SchoolGrades: K-8Distance: 2.5 mi
- 4/10Lakeside High SchoolGrades: 9-12Distance: 2 mi


- California
- Riverside County
- Lake Elsinore
- 92530
- 33056 Garner Rd
Nearby cities
Nearby zip codes
Other Lake Elsinore Topics
