Buy This Property on Auction.com.
This foreclosure property offered by Auction.com may sell below market value.
SAVE THIS PROPERTY NOW on Auction.com to receive alerts about auction dates and status changes.
Auction.com is the nation's largest online real estate auction marketplace with over half-a-million properties sold.
Auction

Price Unknown
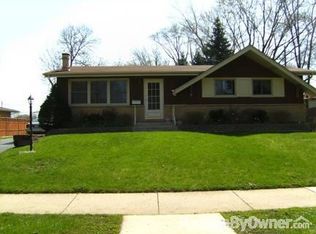
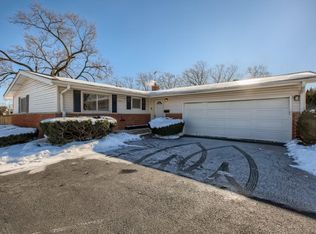
1205 N Wheeling Rd, Mount Prospect, IL 60056
4beds
3baths
1,406sqft
Single Family Residence
Built in 1960
9,147.6 Square Feet Lot
$-- Zestimate®
$--/sqft
$-- HOA
Overview
- 2 hours |
- 25 |
- 0 |
Zillow last checked: 18 hours ago
Listed by:
Auction.com Customer Service,
Auction.com
Source: Auction.com 2
Facts & features
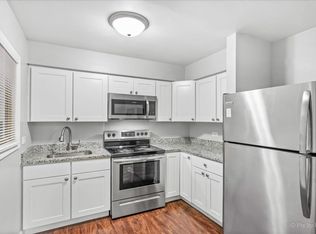
Interior
Bedrooms & bathrooms
- Bedrooms: 4
- Bathrooms: 3
Interior area
- Total structure area: 1,406
- Total interior livable area: 1,406 sqft
Property
Lot
- Size: 9,147.6 Square Feet
Details
- Parcel number: 0326302004
- Special conditions: Auction
Construction
Type & style
- Home type: SingleFamily
- Property subtype: Single Family Residence
Condition
- Year built: 1960
Community & HOA
Location
- Region: Mount Prospect
Financial & listing details
- Tax assessed value: $319,990
- Annual tax amount: $7,815
- Date on market: 4/3/2026
- Lease term: Contact For Details
This listing is brought to you by Auction.com 2
View Auction DetailsEstimated market value
Not available
Estimated sales range
Not available
$2,777/mo
Public tax history
Public tax history
| Year | Property taxes | Tax assessment |
|---|---|---|
| 2023 | $7,815 +5% | $31,999 |
| 2022 | $7,444 +2.5% | $31,999 +14.8% |
| 2021 | $7,263 +1.6% | $27,884 |
| 2020 | $7,150 -0.5% | $27,884 -10.3% |
| 2019 | $7,185 +15.1% | $31,086 +21.5% |
| 2018 | $6,242 -11.9% | $25,594 |
| 2017 | $7,082 +2.5% | $25,594 |
| 2016 | $6,906 +7% | $25,594 +13.9% |
| 2015 | $6,456 -7.6% | $22,472 -7.9% |
| 2014 | $6,989 +2.7% | $24,409 |
| 2013 | $6,803 -5.3% | $24,409 -13.5% |
| 2012 | $7,185 +4% | $28,229 |
| 2011 | $6,911 +9.1% | $28,229 |
| 2010 | $6,337 +11.3% | $28,229 -5.8% |
| 2009 | $5,694 +17.5% | $29,977 -7% |
| 2008 | $4,844 -0.1% | $32,234 -10.1% |
| 2007 | $4,851 +0.7% | $35,842 +19.7% |
| 2006 | $4,818 +1.4% | $29,937 |
| 2005 | $4,752 +5.6% | $29,937 |
| 2004 | $4,499 +4.7% | $29,937 +35.9% |
| 2003 | $4,296 +3.7% | $22,030 |
| 2002 | $4,143 +1.2% | $22,030 |
| 2001 | $4,095 +0.7% | $22,030 +11.3% |
| 2000 | $4,068 +58.8% | $19,799 |
| 1999 | $2,562 | $19,799 |
Find assessor info on the county website
Climate risks
Neighborhood: 60056
Nearby schools
GreatSchools rating
- 5/10Euclid Elementary SchoolGrades: PK-5Distance: 0.1 mi
- 4/10River Trails Middle SchoolGrades: 6-8Distance: 0.9 mi
- 10/10John Hersey High SchoolGrades: 9-12Distance: 2.1 mi
- Illinois
- Cook County
- Mount Prospect
- 60056
- 1205 N Wheeling Rd
Nearby cities
Nearby zip codes
Other Mount Prospect Topics
