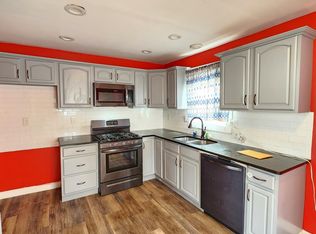
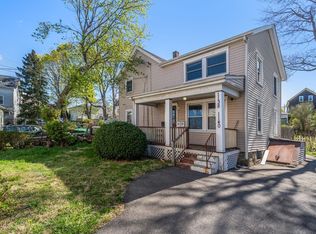
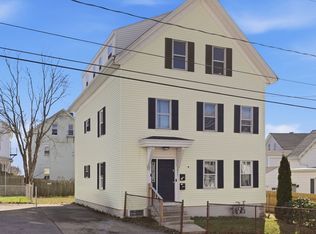
This spacious two-unit multi-family offers 2,132 sq ft, 6 bedrooms, and 2 full bathrooms total—perfect for owner-occupying one unit while renting the other for strong cash flow. Both units are fully vacant, giving you immediate flexibility to customize or lease at current market rates.? Enjoy the rare bonus of off-street parking for up to 4 cars, a huge plus for tenants or multi-generational living. Located just minutes from major highways, you get easy access to amenities and quick commutes:? Boston, MA ˜ 53 minutes?, Providence, RI ˜ 20 minutes, Newport, RI ˜ 29 minutes?. This turnkey property combines comfortable living with solid investment upside.
For sale
Price cut: $19K (6/4)
$480,000
334 Fountain St, Fall River, MA 02721
5beds
2,132sqft
Multi Family
Built in 1900
-- sqft lot
$496,400 Zestimate®
$225/sqft
$-- HOA
What's special
- 118 days |
- 408 |
- 19 |
Zillow last checked:
Listing updated:
Listed by:
Kenneth Kirk 617-548-9914,
eXp Realty LLC - Corporate Office 888-854-7493
Source: MLS PIN,MLS#: 73469855
Tour with a local agent
Facts & features
Interior
Bedrooms & bathrooms
- Bedrooms: 5
- Bathrooms: 2
- Full bathrooms: 2
Features
- Has basement: No
- Has fireplace: No
Interior area
- Total structure area: 2,132
- Total interior livable area: 2,132 sqft
- Finished area above ground: 2,132
Property
Parking
- Total spaces: 4
- Parking features: Paved Drive, Off Street, Deeded, Paved
- Uncovered spaces: 4
Lot
- Size: 3,280 Square Feet
Details
- Parcel number: M:0G05 B:0000 L:0071,3927752
- Zoning: A-2
Construction
Type & style
- Home type: MultiFamily
- Property subtype: Multi Family
Materials
- Foundation: Stone
Condition
- Year built: 1900
Utilities & green energy
- Electric: 220 Volts
- Sewer: Public Sewer
- Water: Public
Community & HOA
Location
- Region: Fall River
Financial & listing details
- Price per square foot: $225/sqft
- Tax assessed value: $392,800
- Annual tax amount: $4,498
- Date on market: 2/9/2026
- Total actual rent: 0
Estimated market value
$496,400
$472,000 - $521,000
$2,099/mo
Price history
| Date | Event | Price |
|---|---|---|
| 6/4/2026 | Price change | $480,000-3.8%$225/sqft |
Source: MLS PIN #73469855 Report a problem | ||
| 5/14/2026 | Listed for sale | $499,000$234/sqft |
Source: eXp Realty #73469855 Report a problem | ||
| 4/24/2026 | Pending sale | $499,000$234/sqft |
Source: eXp Realty #73469855 Report a problem | ||
| 1/20/2026 | Listed for sale | $499,000+24.1%$234/sqft |
Source: MLS PIN #73469855 Report a problem | ||
| 2/27/2023 | Sold | $402,000+3.1%$189/sqft |
Source: MLS PIN #73022877 Report a problem | ||
| 1/6/2023 | Listed for sale | $389,9000%$183/sqft |
Source: MLS PIN #73022877 Report a problem | ||
| 10/27/2022 | Listing removed | $390,000$183/sqft |
Source: MLS PIN #73022877 Report a problem | ||
| 8/9/2022 | Listed for sale | $390,000+42.9%$183/sqft |
Source: MLS PIN #73022877 Report a problem | ||
| 8/7/2019 | Sold | $273,000+1.1%$128/sqft |
Source: Public Record Report a problem | ||
| 6/5/2019 | Listed for sale | $269,900+81%$127/sqft |
Source: Highland Real Estate Group #72513452 Report a problem | ||
| 3/29/2019 | Sold | $149,100-6.8%$70/sqft |
Source: Public Record Report a problem | ||
| 2/15/2019 | Pending sale | -- |
Source: Hudson & Marshall Report a problem | ||
| 1/26/2019 | Listed for sale | -- |
Source: Hudson & Marshall Report a problem | ||
| 1/25/2019 | Pending sale | -- |
Source: Hudson & Marshall Report a problem | ||
| 12/15/2018 | Listed for sale | -- |
Source: Hudson & Marshall Report a problem | ||
| 12/14/2018 | Pending sale | -- |
Source: Hudson & Marshall Report a problem | ||
| 9/29/2018 | Listed for sale | -- |
Source: Hudson & Marshall Report a problem | ||
| 9/28/2018 | Pending sale | -- |
Source: Hudson & Marshall Report a problem | ||
| 9/26/2018 | Sold | $159,900-29.7%$75/sqft |
Source: Public Record Report a problem | ||
| 9/22/2018 | Listed for sale | -- |
Source: Hudson & Marshall Report a problem | ||
| 9/21/2018 | Pending sale | -- |
Source: Hudson & Marshall Report a problem | ||
| 9/15/2018 | Listed for sale | -- |
Source: Hudson & Marshall Report a problem | ||
| 9/14/2018 | Pending sale | -- |
Source: Hudson & Marshall Report a problem | ||
| 9/8/2018 | Listed for sale | -- |
Source: Hudson & Marshall Report a problem | ||
| 9/7/2018 | Pending sale | -- |
Source: Hudson & Marshall Report a problem | ||
| 5/27/2018 | Listed for sale | -- |
Source: Hudson & Marshall Report a problem | ||
| 4/20/2018 | Pending sale | -- |
Source: Hudson & Marshall Report a problem | ||
| 4/8/2008 | Sold | $227,500+144.6%$107/sqft |
Source: Public Record Report a problem | ||
| 10/3/2007 | Sold | $93,000-58.7%$44/sqft |
Source: Public Record Report a problem | ||
| 5/30/2007 | Sold | $225,000$106/sqft |
Source: Public Record Report a problem | ||
Public tax history
| Year | Property taxes | Tax assessment |
|---|---|---|
| 2025 | $4,498 +1.8% | $392,800 +2.1% |
| 2024 | $4,419 +12.7% | $384,600 +20.3% |
| 2023 | $3,921 +8% | $319,600 +11.1% |
| 2022 | $3,630 +8.1% | $287,600 +18.5% |
| 2021 | $3,357 +16.2% | $242,700 +21.4% |
| 2020 | $2,889 +13.5% | $199,900 +14.5% |
| 2019 | $2,546 +1.3% | $174,600 +1.6% |
| 2018 | $2,513 +10.1% | $171,900 +5.5% |
| 2017 | $2,282 +1.1% | $163,000 -1.6% |
| 2016 | $2,257 +4.2% | $165,600 |
| 2015 | $2,166 +0.7% | $165,600 -3.2% |
| 2014 | $2,151 +1.6% | $171,000 -3.7% |
| 2013 | $2,118 +1.8% | $177,500 -6.3% |
| 2012 | $2,081 +3.2% | $189,500 -15.1% |
| 2010 | $2,017 +11.5% | $223,100 -0.6% |
| 2009 | $1,809 -12.6% | $224,400 -16.9% |
| 2008 | $2,070 +40.5% | $269,900 +31.6% |
| 2007 | $1,473 +21.6% | $205,100 +15.7% |
| 2006 | $1,211 +12.9% | $177,300 +25.7% |
| 2005 | $1,073 -0.8% | $141,000 +7% |
| 2004 | $1,082 +10.3% | $131,800 +43.9% |
| 2003 | $981 +8.9% | $91,600 |
| 2002 | $901 | $91,600 |
Find assessor info on the county website
Monthly payment
Est. payment$--/mo
Payment breakdown
Explore the cost of this home by adjusting the details. Changes won't be saved.
All calculations are estimates and provided by Zillow, Inc. for informational purposes only. Actual amounts may vary.
HOA fees may include property taxes on listings classified as Co-Ops. Contact the listing agent and/or owner for fee details.
Mortgage interest rates are dependent on a number of factors, including credit score, down payment, and repayment length. Interest rate data provided by Zillow Group Marketplace, Inc. as of 1/1/1970 from various mortgage lenders with which we have lead or other similar arrangements; the Estimated Payment is an average of those rates.
See how much you could borrow to make a competitive offer.
Climate risks
Neighborhood: Sandy Beach
Nearby schools
GreatSchools rating
- 5/10John J Doran Community SchoolGrades: PK-8Distance: 0.3 mi
- 2/10B M C Durfee High SchoolGrades: 9-12Distance: 2.2 mi
- 2/10Matthew J Kuss Middle SchoolGrades: 6-8Distance: 0.8 mi
A local agent can set up tours, give advice and negotiate with sellers.
A local lender can help you make sure your offer is ready when you are.


- Massachusetts
- Bristol County
- Fall River
- 02721
- Sandy Beach
- 334 Fountain St
Nearby cities
Nearby neighborhoods
Nearby zip codes
Other Fall River Topics
