Highest ROI Turn Key single family Investment property currently on the market in Columbus! Currently is rented out at $1,408 to a stable tenant who is on their second year.
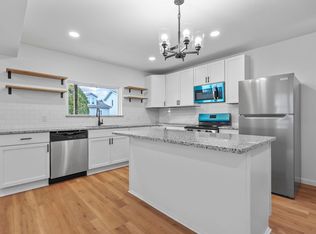
It's a clean 2 bed one bath with updated LVP flooring, vinyl windows, updated bathroom and kitchen.
Nothing to do but collect the cashflow!
For sale
Price cut: $3.9K (8/13)
$129,900
354 S Ogden Ave, Columbus, OH 43204
2beds
1,146sqft
Single Family Residence
Built in 1903
3,049 Square Feet Lot
$-- Zestimate®
$113/sqft
$-- HOA
What's special
Updated bathroomUpdated lvp flooringVinyl windows
- 214 days
- 103
- 10
Zillow last checked:
Listing updated:
Listed by:
Carson D Thrush 614-636-2668,
List
Source: Columbus and Central Ohio Regional MLS ,MLS#: 226008784
Facts & features
Interior
Bedrooms & bathrooms
- Bedrooms: 2
- Bathrooms: 1
- Full bathrooms: 1
Features
- Basement: Cellar
- Common walls with other units/homes: No Common Walls
Interior area
- Total structure area: 1,146
- Total interior livable area: 1,146 sqft
Property
Parking
- Parking features: On Street
- Has uncovered spaces: Yes
Features
- Levels: Two
Lot
- Size: 3,049 Square Feet
Details
- Parcel number: 010001548
- Special conditions: Standard
Construction
Type & style
- Home type: SingleFamily
- Property subtype: Single Family Residence
Materials
- Foundation: Stone
Condition
- New construction: No
- Year built: 1903
Utilities & green energy
- Sewer: Public Sewer
- Water: Public
Community & HOA
Community
- Subdivision: Central Hilltop/Wicklow
HOA
- Has HOA: No
Location
- Region: Columbus
Financial & listing details
- Price per square foot: $113/sqft
- Tax assessed value: $121,300
- Annual tax amount: $1,946
- Date on market: 3/24/2026
Estimated market value
Not available
Estimated sales range
Not available
Not available
Price history
| Date | Event | Price |
|---|---|---|
| 8/13/2026 | Price change | $129,900-2.9%$113/sqft |
Source:  Columbus and Central Ohio Regional MLS #226008784 Report a problem | ||
| 8/6/2026 | Price change | $133,800-0.1%$117/sqft |
Source: Columbus and Central Ohio Regional MLS #226008784 Report a problem | ||
| 5/7/2026 | Price change | $133,900-0.1%$117/sqft |
Source: Columbus and Central Ohio Regional MLS #226008784 Report a problem | ||
| 4/21/2026 | Price change | $134,000-0.7%$117/sqft |
Source: Columbus and Central Ohio Regional MLS #226008784 Report a problem | ||
| 3/24/2026 | Listed for sale | $134,900+57.2%$118/sqft |
Source: Columbus and Central Ohio Regional MLS #226008784 Report a problem | ||
| 3/9/2025 | Listing removed | $1,250$1/sqft |
Source: Zillow Rentals Report a problem | ||
| 2/27/2025 | Price change | $1,250-3.5%$1/sqft |
Source: Zillow Rentals Report a problem | ||
| 2/6/2025 | Price change | $1,295-0.4%$1/sqft |
Source: Zillow Rentals Report a problem | ||
| 2/2/2025 | Listed for rent | $1,300+17.1%$1/sqft |
Source: Zillow Rentals Report a problem | ||
| 11/7/2024 | Sold | $85,800+22.6%$75/sqft |
Source: Columbus and Central Ohio Regional MLS #224028924 Report a problem | ||
| 10/25/2024 | Pending sale | $70,000$61/sqft |
Source: Columbus and Central Ohio Regional MLS #224028924 Report a problem | ||
| 10/21/2024 | Price change | $70,000-36.4%$61/sqft |
Source: Columbus and Central Ohio Regional MLS #224028924 Report a problem | ||
| 9/30/2024 | Price change | $110,000-12%$96/sqft |
Source: Columbus and Central Ohio Regional MLS #224028924 Report a problem | ||
| 9/17/2024 | Price change | $125,000-13.8%$109/sqft |
Source: Columbus and Central Ohio Regional MLS #224028924 Report a problem | ||
| 8/17/2024 | Listed for sale | $145,000+20.9%$127/sqft |
Source: Columbus and Central Ohio Regional MLS #224028924 Report a problem | ||
| 1/13/2024 | Listing removed | -- |
Source: Zillow Rentals Report a problem | ||
| 1/10/2024 | Price change | $1,110-4.3%$1/sqft |
Source: Zillow Rentals Report a problem | ||
| 1/3/2024 | Price change | $1,160-4.1%$1/sqft |
Source: Zillow Rentals Report a problem | ||
| 12/25/2023 | Price change | $1,210-9.4%$1/sqft |
Source: Zillow Rentals Report a problem | ||
| 12/5/2023 | Listed for rent | $1,335+30.4%$1/sqft |
Source: Zillow Rentals Report a problem | ||
| 3/25/2021 | Listing removed | -- |
Source: Zillow Rental Network Premium Report a problem | ||
| 3/6/2021 | Price change | $1,024+5%$1/sqft |
Source: Zillow Rental Network Premium Report a problem | ||
| 1/26/2021 | Price change | $975+0.4%$1/sqft |
Source: Zillow Rental Network Premium Report a problem | ||
| 1/21/2021 | Listed for rent | $971$1/sqft |
Source: Zillow Rental Network Premium Report a problem | ||
| 1/20/2021 | Listing removed | -- |
Source: Columbus and Central Ohio Regional MLS #221000370 Report a problem | ||
| 1/6/2021 | Listed for sale | $119,900+139.8%$105/sqft |
Source: Columbus and Central Ohio Regional MLS #221000370 Report a problem | ||
| 9/16/2020 | Sold | $50,000+25%$44/sqft |
Source: Columbus and Central Ohio Regional MLS #220032454 Report a problem | ||
| 4/27/2017 | Sold | $40,000+73.9%$35/sqft |
Source: Public Record Report a problem | ||
| 4/19/2014 | Sold | $23,000-20.7%$20/sqft |
Source: Columbus and Central Ohio Regional MLS #213038385 Report a problem | ||
| 8/16/2007 | Sold | $29,000$25/sqft |
Source: Public Record Report a problem | ||
Public tax history
| Year | Property taxes | Tax assessment |
|---|---|---|
| 2025 | $1,279 -34.3% | $42,460 |
| 2024 | $1,946 +1.3% | $42,460 |
| 2023 | $1,922 +106.6% | $42,460 +142.6% |
| 2022 | $930 -0.2% | $17,500 |
| 2021 | $932 +33.1% | $17,500 +33.3% |
| 2020 | $700 +2.7% | $13,130 +19.8% |
| 2019 | $682 +100.3% | $10,960 |
| 2018 | $340 | $10,960 |
| 2017 | $340 -51.9% | $10,960 +5.4% |
| 2016 | $707 +22.1% | $10,400 |
| 2015 | $579 | $10,400 |
| 2014 | $579 +7.3% | $10,400 -31.7% |
| 2013 | $540 -40.8% | $15,225 |
| 2011 | $911 -15.7% | $15,225 -19.7% |
| 2010 | $1,080 +6.4% | $18,970 |
| 2008 | $1,015 +18.7% | $18,970 |
| 2007 | $855 +0.3% | -- |
| 2006 | $852 +4.2% | -- |
| 2005 | $818 +15.3% | -- |
| 2004 | $710 +20.1% | -- |
| 2003 | $591 +0.4% | -- |
| 2002 | $588 +10.8% | -- |
| 2001 | $531 -0.5% | -- |
| 2000 | $533 | -- |
Find assessor info on the county website
Monthly payment
Est. payment
Payment breakdown
Explore the cost of this home by adjusting the details. Changes won't be saved.Climate risks
Neighborhood: Central Hilltop

Similar homes
- $136,4003 bd1 ba1.1k sqft212 S Harris Ave, Columbus, OH 43204For Sale

 MLS ID #226031117, Frederick W Rector, Keller Williams Capital Ptnrs. Columbus and Central Ohio Regional MLS
- $159,9003 bd2 ba1.2k sqft346 S Wheatland Ave, Columbus, OH 43204For Sale
 MLS ID #226038058, Carlton A Churchill, Red 1 Realty. Columbus and Central Ohio Regional MLS
- $119,0002 bd1 ba965 sqft84 N Oakley Ave, Columbus, OH 43204For Sale
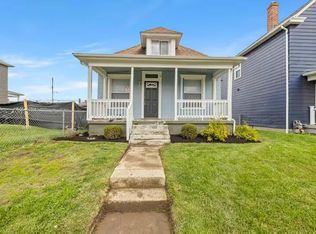 MLS ID #226035752, Tayler B Mulligan, ROOST Real Estate Co.. Columbus and Central Ohio Regional MLS
- $139,9003 bd2 ba1.3k sqft181 N Wheatland Ave, Columbus, OH 43204For Sale
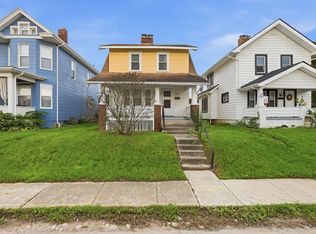 MLS ID #226032157, Michael Mcgee, Mainstay Brokerage LLC. Columbus and Central Ohio Regional MLS
- $119,9004 bd1 ba1.5k sqft223 N Wayne Ave, Columbus, OH 43204For SaleMLS ID #226032671, Michael Mcgee, Mainstay Brokerage LLC. Columbus and Central Ohio Regional MLS
- $169,9002 bd2 ba1k sqft383 S Wayne Ave, Columbus, OH 43204For SaleMLS ID #226037083, Donald A Payne, Vision Realty, Inc.. Columbus and Central Ohio Regional MLS
- $159,9503 bd1 ba1.2k sqft227 S Hague Ave, Columbus, OH 43204For SaleMLS ID #226009629, Brian Rightler, I Heart Real Estate PM. Columbus and Central Ohio Regional MLS
- $169,9003 bd1 ba1.5k sqft53 Warren Ave, Columbus, OH 43204For SaleMLS ID #226039092, Alfath Alim Ahmed, Reafco. Columbus and Central Ohio Regional MLS
- $132,0002 bd1 ba976 sqft2165 Amherst Ave, Columbus, OH 43223For SaleMLS ID #226019756, Remington Lyman, Reafco. Columbus and Central Ohio Regional MLS
- $149,9002 bd1 ba768 sqft229 S Eureka Ave, Columbus, OH 43204For SaleMLS ID #226024561, Deandra Bryant, Trelora Realty, Inc. Columbus and Central Ohio Regional MLS
- $120,0002 bd1 ba784 sqft2243 Safford Ave, Columbus, OH 43223For SaleMLS ID #226033737, Kyonna Wiesner-Shipley, Coldwell Banker Realty. Columbus and Central Ohio Regional MLS
- $160,0002 bd1 ba1k sqft1301 W Town St, Columbus, OH 43222For SaleMLS ID #226039823, Matthew Piper, ERA Real Solutions Realty. Columbus and Central Ohio Regional MLS
- $184,9003 bd2 ba1.4k sqft209 S Ogden Ave, Columbus, OH 43204For SaleMLS ID #226036156, Helen Kifle, RE/MAX Partners. Columbus and Central Ohio Regional MLS
- $165,0003 bd2 ba1.4k sqft205 S Princeton Ave, Columbus, OH 43223For SaleMLS ID #226039813, Amy M Vega, Red 1 Realty. Columbus and Central Ohio Regional MLS
- $135,0003 bd1 ba1.1k sqft906 Bellows Ave, Columbus, OH 43223For SaleMLS ID #226026634, Remington Lyman, Reafco. Columbus and Central Ohio Regional MLS
- $147,4002 bd1 ba732 sqft594 Whitethorne Ave, Columbus, OH 43223For SaleMLS ID #226034360, James E Ross, Red 1 Realty. Columbus and Central Ohio Regional MLS
- $190,0003 bd3 ba1.2k sqft100 S Oakley Ave, Columbus, OH 43204For SaleMLS ID #226017981, Josie Derstine, Coldwell Banker Realty. Columbus and Central Ohio Regional MLS
- $125,0003 bd2 ba847 sqft455 Johnson St, Columbus, OH 43203For SaleMLS ID #226035012, Wil A Marshall, Hart Real Estate Agency LLC. Columbus and Central Ohio Regional MLS
- $130,0003 bd1 ba1.2k sqft2884 E 9th Ave, Columbus, OH 43219For SaleMLS ID #226038376, Carlton A Churchill, Red 1 Realty. Columbus and Central Ohio Regional MLS
- $144,9003 bd1 ba1.2k sqft1795 Eastbrook Dr S, Columbus, OH 43223For SaleMLS ID #226015001, Matthew Kalogeras, Trelora Realty, Inc. Columbus and Central Ohio Regional MLS
