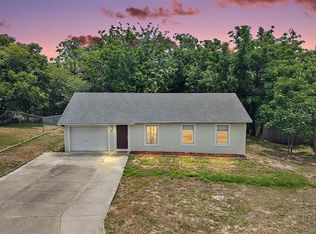
NICE HOME LOCATED IN QUIET NEIGHBORHOOD. This 3 bedroom, 2 bathroom is in good shape and with a little TLC, would be in great shape. Large fenced backyard that slopes in rear. Beyond the fenced area is a wetlands area that means no rear neighbors. This is a Fannie Mae HomePath property. Purchase this property for as little as 3% down. This property is approved for HomePath Mortgage Renovation Mortgage Financing. Call listing agent for more information. All information contained in this listing is believed to be correct at the time of entry, but not guaranteed.
Pre-foreclosure
Street View
Est. $250,800
34 Bay Ridge Loop, Mascotte, FL 34753
3beds
2baths
1,015sqft
SingleFamily
Built in 2000
10,018 Square Feet Lot
$250,800 Zestimate®
$247/sqft
$-- HOA
Overview
- 316 days |
- 14 |
- 1 |
Facts & features
Interior
Bedrooms & bathrooms
- Bedrooms: 3
- Bathrooms: 2
Heating
- Forced air
Cooling
- Central
Interior area
- Total interior livable area: 1,015 sqft
Property
Parking
- Parking features: Garage
Features
- Exterior features: Cement / Concrete
Lot
- Size: 10,018 Square Feet
Details
- Parcel number: 152224002500001700
Construction
Type & style
- Home type: SingleFamily
Materials
- wood frame
- Foundation: Slab
- Roof: Asphalt
Condition
- Year built: 2000
Community & HOA
Location
- Region: Mascotte
Financial & listing details
- Price per square foot: $247/sqft
- Tax assessed value: $206,188
- Annual tax amount: $3,048
Visit our professional directory to find a foreclosure specialist in your area that can help with your home search.
Find a foreclosure agentForeclosure details
Estimated market value
$250,800
$236,000 - $263,000
$1,782/mo
Price history
| Date | Event | Price |
|---|---|---|
| 9/11/2024 | Listing removed | $225,000+7.1%$222/sqft |
Source: | ||
| 9/11/2023 | Listing removed | -- |
Source: | ||
| 9/29/2021 | Sold | $210,000-6.7%$207/sqft |
Source: Public Record Report a problem | ||
| 8/21/2021 | Pending sale | $225,000$222/sqft |
Source: | ||
| 7/22/2021 | Price change | $225,000-2.2%$222/sqft |
Source: | ||
| 7/16/2021 | Listed for sale | $230,000$227/sqft |
Source: | ||
| 7/15/2021 | Pending sale | $230,000$227/sqft |
Source: | ||
| 6/23/2021 | Listed for sale | $230,000$227/sqft |
Source: | ||
| 6/3/2021 | Pending sale | $230,000+70.4%$227/sqft |
Source: | ||
| 6/19/2017 | Sold | $135,000+125%$133/sqft |
Source: Public Record Report a problem | ||
| 6/6/2012 | Sold | $60,000+9.3%$59/sqft |
Source: Public Record Report a problem | ||
| 3/28/2012 | Price change | $54,900-67.7%$54/sqft |
Source: Homepath #G4682034 Report a problem | ||
| 3/22/2012 | Listed for sale | -- |
Source: Homepath #G4682034 Report a problem | ||
| 6/28/2007 | Sold | $170,000+132.9%$167/sqft |
Source: Public Record Report a problem | ||
| 9/10/2001 | Sold | $73,000$72/sqft |
Source: Public Record Report a problem | ||
Public tax history
| Year | Property taxes | Tax assessment |
|---|---|---|
| 2025 | $3,048 +5.3% | $164,630 +2.9% |
| 2024 | $2,896 +9.3% | $159,990 +3% |
| 2023 | $2,649 +4.3% | $155,330 +3% |
| 2022 | $2,539 -11.2% | $150,807 +22.2% |
| 2021 | $2,860 -1.3% | $123,410 |
| 2020 | $2,897 +0.6% | $123,410 +7.1% |
| 2019 | $2,881 +9.6% | $115,194 +10% |
| 2018 | $2,629 | $104,722 +27.2% |
| 2017 | $2,629 +36.8% | $82,317 |
| 2016 | $1,922 +2% | $82,317 +53.4% |
| 2015 | $1,883 +36.4% | $53,654 +1.7% |
| 2014 | $1,381 +14% | $52,766 +2.2% |
| 2013 | $1,211 +8.6% | $51,612 +9.4% |
| 2012 | $1,115 -40.3% | $47,178 -40.3% |
| 2011 | $1,866 +44.8% | $79,037 -20.5% |
| 2010 | $1,288 -10% | $99,438 -8.8% |
| 2009 | $1,431 -24.5% | $109,019 -18.9% |
| 2008 | $1,895 +97.7% | $134,368 +85.7% |
| 2007 | $959 -3.7% | $72,349 +2.5% |
| 2006 | $995 +3.5% | $70,585 +3% |
| 2005 | $962 +4.5% | $68,530 |
| 2004 | $921 +0.5% | -- |
| 2003 | $917 +3.8% | $66,861 +4.9% |
| 2002 | $883 -34.2% | $63,764 +3.6% |
| 2001 | $1,343 +389.8% | $61,576 +378.5% |
| 2000 | $274 | $12,868 |
Find assessor info on the county website
Monthly payment
Climate risks
Neighborhood: 34753
Nearby schools
GreatSchools rating
- 2/10Groveland Elementary SchoolGrades: PK-5Distance: 3.2 mi
- 4/10Gray Middle SchoolGrades: 6-8Distance: 2.5 mi
- 4/10South Lake High SchoolGrades: 9-12Distance: 4.7 mi
Schools provided by the listing agent
- Elementary: MASCOTTE ELEMENTARY
- Middle: GRAY MIDDLE SCHOOL
- High: SOUTH LAKE HIGH
Source: The MLS. This data may not be complete. We recommend contacting the local school district to confirm school assignments for this home.
- $230,3003 bd2 ba1k sqft32 Bay Ridge Loop, Mascotte, FL 34753Off Market
- $250,0003 bd2 ba1k sqft36 Bay Ridge Loop, Mascotte, FL 34753For Sale
- $257,1003 bd2 ba1k sqft30 Bay Ridge Loop, Mascotte, FL 34753Off Market
- $215,9002 bd2 ba954 sqft38 Bay Ridge Loop, Mascotte, FL 34753Off Market
- $229,5003 bd2 ba1k sqft15 Bay Ridge Loop, Mascotte, FL 34753Off Market
- $232,4003 bd2 ba1k sqft40 Bay Ridge Loop, Mascotte, FL 34753Off Market
- $239,8003 bd2 ba1k sqft13 Bay Ridge Loop, Mascotte, FL 34753Off Market
- $288,7003 bd2 ba1.5k sqft28 Bay Ridge Loop, Mascotte, FL 34753Off Market
Similar homes
- $274,5003 bd2 ba1.2k sqft207 Howard Ct, Mascotte, FL 34753For Sale

 MLS ID #GC541021, Gordon Weidler, FLORIDA HOMES REALTY & MORTGAGE GVILLE. Stellar MLS
 - $244,9003 bd2 ba1k sqft325 Elizabeth Ave, Mascotte, FL 34753For Sale
 MLS ID #G5106213, Madeline Guevara, MICKI BLACKBURN REALTY. Stellar MLS
 - $259,0003 bd1 ba1.4k sqft610 Palmetto Dr, Mascotte, FL 34753For Sale
 MLS ID #G5111638, Katelyn Raber, WHEATLEY REALTY GROUP. Stellar MLS
 - $280,0003 bd2 ba1.3k sqft4250 Worthington Pl, Mascotte, FL 34753For Sale
 MLS ID #S5147823, Darcy Vilches Jimenez, VIROAN REALTY, LLC. Stellar MLS
 - $289,9904 bd2 ba1.3k sqft108 Brittany Rd, Mascotte, FL 34753For SaleMLS ID #O6408110, Nikki Songie, PLATINUM KEY REALTY INC. Stellar MLS
- $295,0003 bd2 ba1.2k sqft1613 Orne St, Mascotte, FL 34753For SaleMLS ID #O6410383, Josue Soto, EXP REALTY LLC. Stellar MLS
- $305,4903 bd2 ba1.4k sqft1896 Piedmont Ct, Mascotte, FL 34753For SaleMLS ID #O6410125, Hector Rondon Campos PA, LPT REALTY, LLC. Stellar MLS
- $270,0003 bd1 ba1k sqft248 E Magnolia St, Groveland, FL 34736For SaleMLS ID #O6424896, Trevor Zwick, KELLER WILLIAMS ELITE PARTNERS III REALTY. Stellar MLS
- $249,9003 bd1 ba1k sqft15246 Sable Ave, Groveland, FL 34736For SaleMLS ID #S5151266, Ruthann Fong, KELLY RIGHT REAL ESTATE. Stellar MLS
- $260,0003 bd2 ba1.1k sqft6310 Belle Isles Dr, Groveland, FL 34736For SaleMLS ID #A4696395, Laura Auten, ELEVATE REALTY LLC. Stellar MLS
- $349,9003 bd2 ba1.4k sqft1597 Orne St, Mascotte, FL 34753For SaleMLS ID #V4948614, Ricardo Adames, LA ROSA REALTY CW PROPERTIES L. Stellar MLS
- $260,0003 bd2 ba1.1k sqft17611 S Highway 33, Groveland, FL 34736For SaleMLS ID #G5112710, Shoni Hinkle, REALTY EXECUTIVES IN THE VILLAGES. Stellar MLS
- $225,0002 bd1 ba912 sqft167 Ivey St, Groveland, FL 34736For SaleMLS ID #O6420834, Sohan Singh, KNS REALTY INC. Stellar MLS
- $150,0003 bd2 ba1.3k sqft737 Albrook St, Mascotte, FL 34753For SaleMLS ID #O6395331, Kyler Moreland, REMAX SUNSTATE REALTY. Stellar MLS
- $270,0002 bd1 ba1k sqft627 Warner St, Groveland, FL 34736For SaleMLS ID #O6423672, Laura Petersen, YOUR HOME SOLD GUARANTEED REALTY. Stellar MLS
- $250,0003 bd2 ba1.4k sqft21122 Lionheart Dr, Leesburg, FL 34748For SaleMLS ID #G5104218, Tonya Tibbetts, FLORIDA PLUS REALTY, LLC. Stellar MLS
- $279,0003 bd2 ba1.4k sqft373 E Waldo St, Groveland, FL 34736For SaleMLS ID #A4691944, David Hickey, PATRIOTIC REAL ESTATE. Stellar MLS
- $225,0003 bd2 ba1.4k sqft21230 Royal Saint Georges Ln, Leesburg, FL 34748For SaleMLS ID #G5113498, Tonya Tibbetts, FLORIDA PLUS REALTY, LLC. Stellar MLS
- $275,0002 bd2 ba1.4k sqft8856 Courtyard Ln, Groveland, FL 34736For SaleMLS ID #G5109575, Brandie Mathison-Klein, KELLER WILLIAMS ELITE PARTNERS III REALTY. Stellar MLS
- $275,0003 bd2 ba1.4k sqft4921 Glen Coe St, Leesburg, FL 34748For SaleMLS ID #G5108958, Tonya Tibbetts, FLORIDA PLUS REALTY, LLC. Stellar MLS
