$737,700
4 bd|2 ba|2.7k sqft
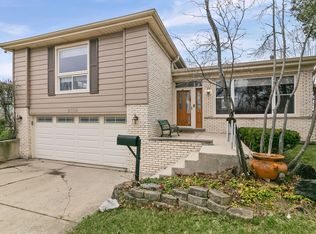
9400 Neenah Ave, Morton Grove, IL 60053
Off Market
Likely to sell faster than
Zillow last checked:
Listing updated:
Praveen Mathew 847-832-0002,
@properties Christie's International Real Estate
Not available
Estimated sales range
Not available
Not available
| Date | Event | Price |
|---|---|---|
| 6/11/2026 | Listed for sale | $949,000+58.4%$270/sqft |
Source: | ||
| 9/4/2018 | Listing removed | $599,000$171/sqft |
Source: Dream Town Realty #09980686 Report a problem | ||
| 9/4/2018 | Listed for sale | $599,000+8.7%$171/sqft |
Source: Dream Town Realty #09980686 Report a problem | ||
| 8/30/2018 | Sold | $551,000-8%$157/sqft |
Source: | ||
| 7/31/2018 | Pending sale | $599,000$171/sqft |
Source: Dream Town Realty #09980686 Report a problem | ||
| 6/11/2018 | Price change | $599,000-3.2%$171/sqft |
Source: Dream Town Realty #09980686 Report a problem | ||
| 4/18/2018 | Price change | $619,000-4.6%$176/sqft |
Source: Dream Town Realty #09980686 Report a problem | ||
| 3/7/2018 | Listed for sale | $649,000$185/sqft |
Source: Dream Town Realty #09876025 Report a problem | ||
| Year | Property taxes | Tax assessment |
|---|---|---|
| 2024 | -- | $53,722 +0% |
| 2023 | $14,613 +4.7% | $53,721 |
| 2022 | $13,961 +3.2% | $53,721 +17.6% |
| 2021 | $13,522 +1.8% | $45,664 |
| 2020 | $13,280 +0.2% | $45,664 -10% |
| 2019 | $13,255 +8.6% | $50,738 +11.8% |
| 2018 | $12,203 -0.5% | $45,390 |
| 2017 | $12,266 -7.2% | $45,390 -9.9% |
| 2016 | $13,216 +0.9% | $50,362 +9.8% |
| 2015 | $13,092 -0.7% | $45,869 -2.3% |
| 2014 | $13,181 +1.9% | $46,960 |
| 2013 | $12,936 +2.6% | $46,960 -6.2% |
| 2012 | $12,606 +0.8% | $50,046 -4.9% |
| 2011 | $12,501 -1.2% | $52,607 -9.6% |
| 2010 | $12,659 -5.3% | $58,172 -11.8% |
| 2009 | $13,362 +8% | $65,964 -12% |
| 2008 | $12,367 +6% | $74,959 |
| 2007 | $11,670 +11.1% | $74,959 +24.1% |
| 2006 | $10,503 +4.9% | $60,392 |
| 2005 | $10,016 +5.9% | $60,392 |
| 2004 | $9,456 +19.7% | $60,392 +35.9% |
| 2003 | $7,903 +6.2% | $44,439 |
| 2002 | $7,443 +5.2% | $44,439 |
| 2001 | $7,075 +2.7% | $44,439 +7.9% |
| 2000 | $6,892 -4.6% | $41,192 |
| 1999 | $7,221 | $41,192 |
Find assessor info on the county website
Source: MRED as distributed by MLS GRID. This data may not be complete. We recommend contacting the local school district to confirm school assignments for this home.
A local agent can set up tours, give advice and negotiate with sellers.
A local lender can help you make sure your offer is ready when you are.