$95,800
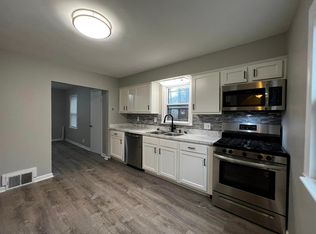
4 bd|2 ba|1.1k sqft
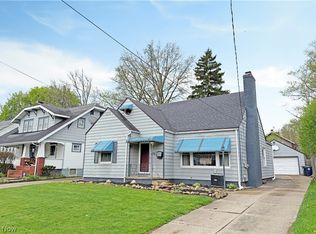
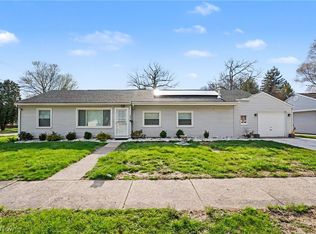
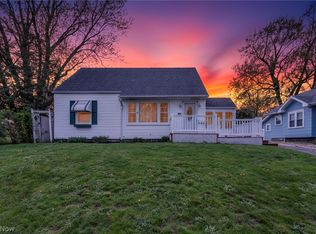
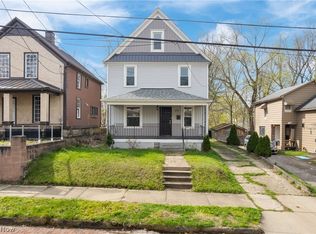
1225 Packard Dr, Akron, OH 44320
Off Market
Zillow last checked:
Listing updated:
Jorunn S Stimbra 330-715-6404 jstimbra@russellrealty.com,
Russell Real Estate Services
Not available
Estimated sales range
Not available
Not available
| Date | Event | Price |
|---|---|---|
| 4/18/2026 | Listed for sale | $154,900+2998%$115/sqft |
Source: | ||
| 9/15/2008 | Sold | $5,000-50%$4/sqft |
Source: Public Record Report a problem | ||
| 7/19/2008 | Price change | $9,999-20%$7/sqft |
Source: Listhub #1524474 Report a problem | ||
| 6/24/2008 | Listed for sale | $12,500-68.8%$9/sqft |
Source: Listhub #1524474 Report a problem | ||
| 6/20/2008 | Sold | $40,000-38.5%$30/sqft |
Source: Public Record Report a problem | ||
| 3/30/2006 | Sold | $65,000+136.4%$48/sqft |
Source: Public Record Report a problem | ||
| 1/30/2006 | Sold | $27,500-51.8%$20/sqft |
Source: Public Record Report a problem | ||
| 10/7/2005 | Sold | $57,000+9.6%$42/sqft |
Source: Public Record Report a problem | ||
| 9/26/2001 | Sold | $52,000+420%$39/sqft |
Source: Public Record Report a problem | ||
| 7/8/1997 | Sold | $10,000-50%$7/sqft |
Source: Public Record Report a problem | ||
| 2/6/1997 | Sold | $20,000$15/sqft |
Source: Public Record Report a problem | ||
| 10/7/1996 | Sold | $20,000$15/sqft |
Source: Public Record Report a problem | ||
| Year | Property taxes | Tax assessment |
|---|---|---|
| 2024 | $1,745 +18.3% | $24,780 |
| 2023 | $1,476 +25.4% | $24,780 +65% |
| 2022 | $1,177 -0.1% | $15,016 |
| 2021 | $1,178 | $15,016 |
| 2020 | -- | $15,016 +12.8% |
| 2019 | $1,196 +6.2% | $13,311 +0% |
| 2018 | $1,126 -2.6% | $13,310 |
| 2017 | $1,156 | $13,310 -1.5% |
| 2016 | $1,156 | $13,510 |
| 2015 | $1,156 -9.4% | $13,510 |
| 2014 | $1,276 -3.8% | $13,510 -17.2% |
| 2013 | $1,326 +1.9% | $16,320 |
| 2012 | $1,302 +26.1% | $16,320 0% |
| 2011 | $1,032 -5% | $16,328 -9.4% |
| 2010 | $1,087 | $18,032 |
| 2009 | -- | $18,032 |
| 2008 | $1,802 -45.4% | $18,032 -10.4% |
| 2007 | $3,302 +78.2% | $20,115 -0.7% |
| 2006 | $1,853 +72.3% | $20,255 -2% |
| 2005 | $1,075 +93.6% | $20,675 +7.7% |
| 2004 | $555 -45% | $19,188 |
| 2003 | $1,010 -53% | $19,188 |
| 2002 | $2,149 +52% | $19,188 +18% |
| 2001 | $1,414 +70.7% | $16,265 |
| 2000 | $828 | $16,265 |
Find assessor info on the county website
Source: MLS Now. This data may not be complete. We recommend contacting the local school district to confirm school assignments for this home.
A local agent can set up tours, give advice and negotiate with sellers.