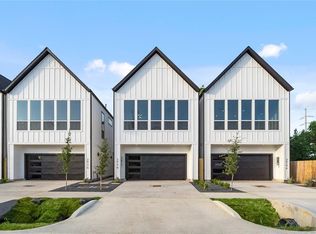
Charming Home for Rent Near Houston Airport Discover your perfect retreat in this beautifully upgraded home, conveniently located just minutes from Houston Airport! This spacious and modern residence is packed with premium amenities to ensure comfort and convenience. Key Features: Prime Location: Quick access to Houston Airport, major highways, and nearby shopping, dining, and entertainment. Modern Upgrades: Stylish finishes, updated kitchen with stainless steel appliances, and gleaming hardwood or tile flooring throughout. Spacious Layout: Open-concept living areas, perfect for relaxing or entertaining, with plenty of natural light. Luxurious Amenities: Enjoy a fully equipped gym, sparkling community pool, and lush green spaces for outdoor activities. Comfort & Convenience: Central A/C, in-unit washer/dryer, ample storage, and smart home features for modern living. Family-Friendly: Quiet neighborhood with access to top-rated schools and parks. Whether you're a frequent traveler, relocating professional, or simply seeking a vibrant community, this home offers the perfect blend of style, functionality, and proximity to all that Houston has to offer. Don't miss out schedule a tour today! Contact us for pricing and availability details. Charming Home for Rent Near Houston Airport Discover your perfect retreat in this beautifully upgraded home, conveniently located just minutes from Houston Airport! This spacious and modern residence is packed with premium amenities to ensure comfort and convenience. Key Features: Prime Location: Quick access to Houston Airport, major highways, and nearby shopping, dining, and entertainment. Modern Upgrades: Stylish finishes, updated kitchen with stainless steel appliances, and gleaming hardwood or tile flooring throughout. Spacious Layout: Open-concept living areas, perfect for relaxing or entertaining, with plenty of natural light. Luxurious Amenities: Enjoy a fully equipped gym, sparkling community pool, and lush green spaces for outdoor activities. Comfort & Convenience: Central A/C, in-unit washer/dryer, ample storage, and smart home features for modern living. Family-Friendly: Quiet neighborhood with access to top-rated schools and parks. Whether you're a frequent traveler, relocating professional, or simply seeking a vibrant community, this home offers the perfect blend of style, functionality, and proximity to all that Houston has to offer. Don't miss out schedule a tour today! Contact us for pricing and availability details.
This property is off market, which means it's not currently listed for sale or rent on Zillow. This may be different from what's available on other websites or public sources.