$229,700
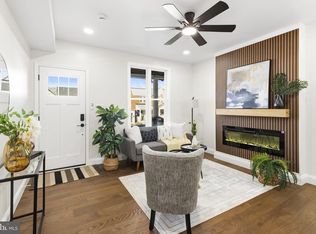
3 bd|2 ba|1.2k sqft
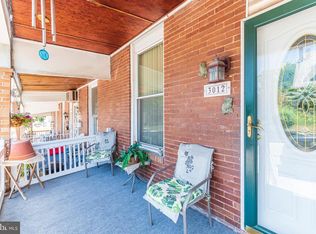
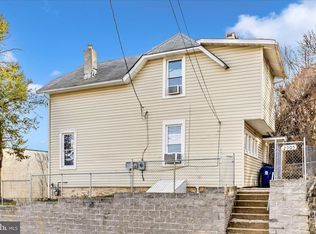
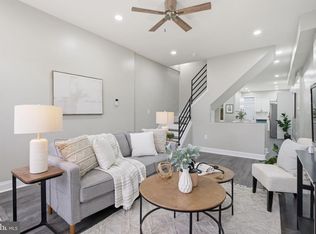
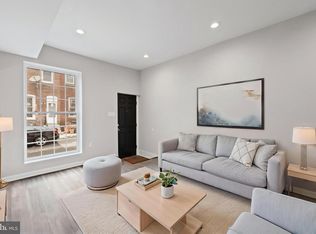
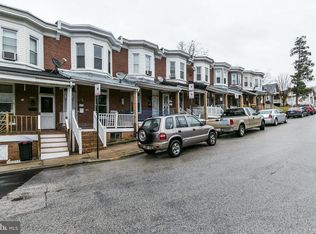
3006 Weaver Ave, Baltimore, MD 21214
Off Market
Likely to sell faster than
Zillow last checked: 7 hours ago
Listing updated: February 26, 2026 at 12:52pm
Andrea Zayas 443-629-7673,
ProComp Realtors, Inc. 410-922-7755
$250,500
$238,000 - $263,000
$2,175/mo
| Date | Event | Price |
|---|---|---|
| 2/27/2026 | Pending sale | $249,000$148/sqft |
Source: | ||
| 2/24/2026 | Listed for sale | $249,000-0.4%$148/sqft |
Source: | ||
| 1/21/2026 | Listing removed | $249,900$148/sqft |
Source: | ||
| 12/18/2025 | Price change | $249,900-1.6%$148/sqft |
Source: | ||
| 11/16/2025 | Listed for sale | $254,000-0.4%$151/sqft |
Source: | ||
| 11/5/2025 | Listing removed | $255,000$151/sqft |
Source: | ||
| 10/2/2025 | Price change | $255,000-1.5%$151/sqft |
Source: | ||
| 8/30/2025 | Listed for sale | $259,000-2.3%$154/sqft |
Source: | ||
| 8/26/2025 | Listing removed | $265,000$157/sqft |
Source: | ||
| 8/13/2025 | Price change | $265,000-0.9%$157/sqft |
Source: | ||
| 7/10/2025 | Price change | $267,500-2.4%$159/sqft |
Source: | ||
| 6/3/2025 | Price change | $274,000-1.8%$162/sqft |
Source: | ||
| 4/30/2025 | Price change | $279,000-5.4%$165/sqft |
Source: | ||
| 4/10/2025 | Listed for sale | $295,000+82.7%$175/sqft |
Source: | ||
| 8/12/2024 | Sold | $161,500-6.9%$96/sqft |
Source: | ||
| 7/12/2024 | Pending sale | $173,500$103/sqft |
Source: | ||
| 7/6/2024 | Listed for sale | $173,500$103/sqft |
Source: | ||
| 6/22/2024 | Contingent | $173,500$103/sqft |
Source: | ||
| 6/15/2024 | Listed for sale | $173,500$103/sqft |
Source: | ||
| Year | Property taxes | Tax assessment |
|---|---|---|
| 2025 | -- | $134,300 +6.7% |
| 2024 | $2,971 +2.9% | $125,900 +2.9% |
| 2023 | $2,887 +3% | $122,333 -2.8% |
| 2022 | $2,803 +3.1% | $125,900 +9.3% |
| 2021 | $2,719 +0.9% | $115,200 +0.9% |
| 2020 | $2,694 +0.9% | $114,167 -0.9% |
| 2019 | $2,670 +0.9% | $115,200 +2.8% |
| 2018 | $2,646 | $112,100 |
| 2017 | $2,646 +241.9% | $112,100 |
| 2016 | $774 | $112,100 |
| 2015 | $774 | $112,100 |
| 2014 | $774 | $112,100 |
| 2013 | -- | $112,100 -6.1% |
| 2012 | -- | $119,400 |
| 2011 | -- | $119,400 |
| 2010 | -- | $119,400 -1.6% |
| 2009 | -- | $121,320 +19.3% |
| 2008 | -- | $101,660 +24% |
| 2007 | -- | $82,000 +31.5% |
| 2006 | -- | $62,340 +3.8% |
| 2005 | -- | $60,070 +3.9% |
| 2004 | -- | $57,800 +4.1% |
| 2003 | -- | $55,530 +5.4% |
| 2002 | -- | $52,686 +5.7% |
| 2001 | -- | $49,843 |
Find assessor info on the county website
Source: Bright MLS. This data may not be complete. We recommend contacting the local school district to confirm school assignments for this home.