$220,600
3 bd|1 ba|1.2k sqft
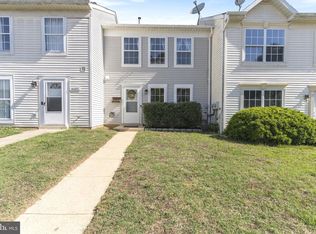
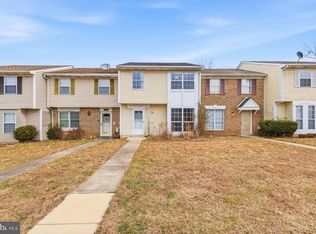
46095 Lucca Way, Lexington Park, MD 20653
Off Market

Zillow last checked:
Listing updated:
Aleayah Dyson 240-237-7576,
Home Towne Real Estate 3018624000
$242,400
$230,000 - $255,000
$2,019/mo
| Date | Event | Price |
|---|---|---|
| 3/22/2023 | Listing removed | $209,900$159/sqft |
Source: | ||
| 3/18/2023 | Listed for sale | $209,900$159/sqft |
Source: | ||
| 3/12/2023 | Pending sale | $209,900$159/sqft |
Source: | ||
| 2/19/2023 | Listed for sale | $209,900+13.5%$159/sqft |
Source: | ||
| 8/13/2021 | Listing removed | $185,000$140/sqft |
Source: | ||
| 7/5/2021 | Listed for sale | $185,000+72.9%$140/sqft |
Source: | ||
| 9/5/2017 | Sold | $107,020-1.8%$81/sqft |
Source: Public Record Report a problem | ||
| 7/13/2017 | Pending sale | $108,995$83/sqft |
Source: RE/MAX 100 #SM9989361 Report a problem | ||
| 6/27/2017 | Listed for sale | $108,995-1.8%$83/sqft |
Source: RE/MAX 100 #SM9989361 Report a problem | ||
| 12/10/2015 | Sold | $111,000-4.3%$84/sqft |
Source: Public Record Report a problem | ||
| 11/15/2015 | Pending sale | $116,000$88/sqft |
Source: RE/MAX One #SM8742803 Report a problem | ||
| 11/6/2015 | Price change | $116,000-7.2%$88/sqft |
Source: RE/MAX One #SM8742803 Report a problem | ||
| 9/9/2015 | Price change | $125,000+108.7%$95/sqft |
Source: RE/MAX One #SM8742803 Report a problem | ||
| 7/16/2015 | Pending sale | $59,900$45/sqft |
Source: Homepath #SM8596527 Report a problem | ||
| 6/30/2015 | Listed for sale | $59,900-23.8%$45/sqft |
Source: Homepath #SM8596527 Report a problem | ||
| 6/12/2015 | Sold | $78,591+21.1%$60/sqft |
Source: Public Record Report a problem | ||
| 6/10/2015 | Price change | $64,900-7.2%$49/sqft |
Source: Homepath #SM8596527 Report a problem | ||
| 5/13/2015 | Listed for sale | $69,900-12.5%$53/sqft |
Source: Homepath #SM8596527 Report a problem | ||
| 11/3/1994 | Sold | $79,900$61/sqft |
Source: Public Record Report a problem | ||
| Year | Property taxes | Tax assessment |
|---|---|---|
| 2025 | $1,497 -3.1% | $191,067 +18.7% |
| 2024 | $1,545 +23% | $160,933 +23% |
| 2023 | $1,255 +5.6% | $130,800 |
| 2022 | $1,189 +5.9% | $130,800 +11.9% |
| 2021 | $1,122 +6.3% | $116,933 +6.3% |
| 2020 | $1,056 | $110,000 |
| 2019 | $1,056 | $110,000 |
| 2018 | $1,056 -8.1% | $110,000 -7.2% |
| 2017 | $1,148 -36% | $118,500 |
| 2016 | $1,793 | $118,500 |
| 2015 | $1,793 | $118,500 -5.1% |
| 2014 | $1,793 | $124,900 |
| 2013 | -- | $124,900 |
| 2012 | -- | $124,900 -24.2% |
| 2011 | -- | $164,780 +4.8% |
| 2010 | -- | $157,260 +5% |
| 2009 | -- | $149,740 +5.3% |
| 2008 | -- | $142,220 +14.2% |
| 2007 | -- | $124,536 +16.5% |
| 2006 | -- | $106,853 +19.8% |
| 2005 | -- | $89,170 +1.5% |
| 2004 | -- | $87,850 +1.5% |
| 2003 | -- | $86,530 +1.5% |
| 2002 | -- | $85,210 +4.1% |
| 2001 | -- | $81,882 |
Find assessor info on the county website
Source: Bright MLS. This data may not be complete. We recommend contacting the local school district to confirm school assignments for this home.
A local agent can set up tours, give advice and negotiate with sellers.