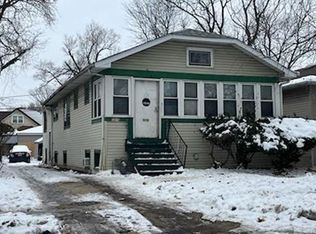
Beautifully rehabbed with hardwood floors, new ceramic tiling in kitchen and bath. Large bedrooms and finished basement. Kitchen has breakfast bar and granite counters and all stainless steel appliances. Agent incentive $1,000 is contract by Jan. 25th and close the deal.
Foreclosed
Est. $301,200
1227 S 19th Ave, Maywood, IL 60153
3beds
1baths
1,700sqft
SingleFamily
Built in 1924
4,410 Square Feet Lot
$301,200 Zestimate®
$177/sqft
$-- HOA
Overview
- 59 days |
- 29 |
- 0 |
Facts & features
Interior
Bedrooms & bathrooms
- Bedrooms: 3
- Bathrooms: 1.5
Cooling
- None
Interior area
- Total interior livable area: 1,700 sqft
Property
Parking
- Parking features: Garage - Attached
Features
- Exterior features: Other
Lot
- Size: 4,410 Square Feet
Details
- Parcel number: 1515103015
Construction
Type & style
- Home type: SingleFamily
Materials
- Roof: Tile
Condition
- Year built: 1924
Community & HOA
Location
- Region: Maywood
Financial & listing details
- Price per square foot: $177/sqft
- Tax assessed value: $209,990
- Annual tax amount: $9,047
Visit our professional directory to find a foreclosure specialist in your area that can help with your home search.
Find a foreclosure agentForeclosure details
Estimated market value
$301,200
$283,000 - $319,000
$2,529/mo
Price history
Price history
| Date | Event | Price |
|---|---|---|
| 9/16/2025 | Listing removed | $249,900$147/sqft |
Source: | ||
| 8/6/2025 | Price change | $249,900-3.5%$147/sqft |
Source: | ||
| 7/15/2025 | Price change | $259,000-2.3%$152/sqft |
Source: | ||
| 3/21/2025 | Listed for sale | $265,000+1.1%$156/sqft |
Source: | ||
| 1/24/2023 | Sold | $262,000+1.2%$154/sqft |
Source: | ||
| 12/2/2022 | Contingent | $259,000$152/sqft |
Source: | ||
| 11/14/2022 | Price change | $259,000-3.7%$152/sqft |
Source: | ||
| 10/20/2022 | Listed for sale | $269,000+187.7%$158/sqft |
Source: | ||
| 3/11/2011 | Sold | $93,500-4.1%$55/sqft |
Source: | ||
| 1/9/2011 | Price change | $97,500-2.4%$57/sqft |
Source: NRT Chicago #07687029 Report a problem | ||
| 12/24/2010 | Price change | $99,900-4.8%$59/sqft |
Source: NRT Chicago #07687029 Report a problem | ||
| 12/18/2010 | Price change | $104,900-7.1%$62/sqft |
Source: NRT Chicago #07687029 Report a problem | ||
| 12/13/2010 | Price change | $112,900-5.8%$66/sqft |
Source: NRT Chicago #07687029 Report a problem | ||
| 12/5/2010 | Listed for sale | $119,900+228.5%$71/sqft |
Source: NRT Chicago #07687029 Report a problem | ||
| 9/27/2010 | Sold | $36,500-8.5%$21/sqft |
Source: Berkshire Hathaway HomeServices Koenig Rubloff #07568138_60153 Report a problem | ||
| 7/3/2010 | Price change | $39,900$23/sqft |
Source: Koenig & Strey Real Living #07568138 Report a problem | ||
| 6/9/2010 | Listed for sale | -- |
Source: foreclosure.com Report a problem | ||
Public tax history
Public tax history
| Year | Property taxes | Tax assessment |
|---|---|---|
| 2023 | $9,047 +43.5% | $20,999 +43.6% |
| 2022 | $6,305 -1.2% | $14,619 |
| 2021 | $6,381 +0.5% | $14,619 |
| 2020 | $6,347 +25.3% | $14,619 +27.7% |
| 2019 | $5,066 +2.9% | $11,447 |
| 2018 | $4,924 +2.7% | $11,447 |
| 2017 | $4,795 +28.5% | $11,447 +34.6% |
| 2016 | $3,732 +9.6% | $8,507 |
| 2015 | $3,406 -31.3% | $8,507 -28.7% |
| 2014 | $4,960 +44% | $11,938 +22.4% |
| 2013 | $3,444 -7.8% | $9,750 -7.8% |
| 2012 | $3,734 -3.4% | $10,578 |
| 2011 | $3,865 -15.4% | $10,578 -25.6% |
| 2010 | $4,570 +10.8% | $14,214 -14.3% |
| 2009 | $4,125 +4.9% | $16,585 -5% |
| 2008 | $3,933 +0.7% | $17,458 +15.8% |
| 2007 | $3,905 +5.3% | $15,070 |
| 2006 | $3,710 +9.2% | $15,070 |
| 2005 | $3,397 -2.8% | $15,070 +25.7% |
| 2004 | $3,493 +3.7% | $11,990 |
| 2003 | $3,368 +35.7% | $11,990 |
| 2002 | $2,482 +34.3% | $11,990 +54.9% |
| 2001 | $1,848 +3.2% | $7,741 |
| 2000 | $1,790 +28% | $7,741 |
| 1999 | $1,398 | $7,741 |
Find assessor info on the county website
Monthly payment
Estimated monthly payment
All calculations are estimates and provided by Zillow, Inc. for informational purposes only. Actual amounts may vary.
HOA fees may include property taxes on listings classified as Co-Ops. Contact the listing agent and/or owner for fee details.
Mortgage interest rates are dependent on a number of factors, including credit score, down payment, and repayment length. Interest rate data provided by Zillow Group Marketplace, Inc. as of 1/1/1970 from various mortgage lenders with which we have lead or other similar arrangements; the Estimated Payment is an average of those rates.
See how much you could borrow to make a competitive offer.
Climate risks
Neighborhood: 60153
Nearby schools
GreatSchools rating
- 5/10Irving Middle SchoolGrades: 5-8Distance: 0.3 mi
- 2/10Proviso East High SchoolGrades: 9-12Distance: 1.2 mi
- 8/10Roosevelt Elementary SchoolGrades: PK-5Distance: 0.6 mi
Schools provided by the listing agent
- District: 89
Source: The MLS. This data may not be complete. We recommend contacting the local school district to confirm school assignments for this home.
- Illinois
- Cook County
- Maywood
- 60153
- Maywood
- 1227 S 19th Ave
Nearby cities
Nearby zip codes
Other Maywood Topics
