$365,400
3 bd|2 ba|1.2k sqft
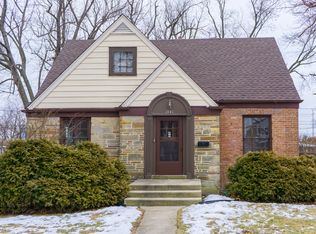
1427 Bristol Ave, Westchester, IL 60154
Off Market
Zillow last checked: 7 hours ago
Listing updated: March 12, 2026 at 07:16am
Omer Houston 630-833-1700,
L.W. Reedy Real Estate
Not available
Estimated sales range
Not available
Not available
| Date | Event | Price |
|---|---|---|
| 3/12/2026 | Price change | $367,000-2.1%$300/sqft |
Source: | ||
| 12/9/2025 | Listed for sale | $375,000+135.9%$306/sqft |
Source: | ||
| 8/18/2015 | Sold | $158,950-6.4%$130/sqft |
Source: | ||
| 4/22/2015 | Pending sale | $169,900$139/sqft |
Source: Homepath #08802863 Report a problem | ||
| 3/31/2015 | Price change | $169,900-5.6%$139/sqft |
Source: Homepath #08802863 Report a problem | ||
| 2/24/2015 | Price change | $179,900-5.3%$147/sqft |
Source: Homepath #08802863 Report a problem | ||
| 1/20/2015 | Price change | $189,900-7.4%$155/sqft |
Source: Homepath #08802863 Report a problem | ||
| 12/17/2014 | Listed for sale | $205,000+12.3%$167/sqft |
Source: Kensington Properties RE, LLC #08802863 Report a problem | ||
| 6/24/2014 | Listing removed | $182,500$149/sqft |
Source: Coldwell Banker Stratford Place #08395210 Report a problem | ||
| 10/18/2013 | Price change | $182,500-3.9%$149/sqft |
Source: Coldwell Banker Stratford Place #08395210 Report a problem | ||
| 10/12/2013 | Price change | $189,900-11.6%$155/sqft |
Source: Coldwell Banker Stratford Place #08395210 Report a problem | ||
| 8/16/2013 | Listed for sale | $214,9000%$175/sqft |
Source: Coldwell Banker Stratford Place #08395210 Report a problem | ||
| 1/15/2004 | Sold | $215,000+56.9%$176/sqft |
Source: Public Record Report a problem | ||
| 7/20/1995 | Sold | $137,000$112/sqft |
Source: Public Record Report a problem | ||
| Year | Property taxes | Tax assessment |
|---|---|---|
| 2023 | $4,904 -10.6% | $22,000 +2.8% |
| 2022 | $5,484 +2.8% | $21,396 |
| 2021 | $5,335 +1.1% | $21,396 |
| 2020 | $5,278 +5.2% | $21,396 +0.9% |
| 2019 | $5,019 +1.4% | $21,196 |
| 2018 | $4,952 +1.6% | $21,196 |
| 2017 | $4,873 +12.5% | $21,196 +22.2% |
| 2016 | $4,332 +2.2% | $17,349 |
| 2015 | $4,240 +2% | $17,349 |
| 2014 | $4,157 -6.6% | $17,349 -14.7% |
| 2013 | $4,449 +2.4% | $20,329 |
| 2012 | $4,346 +2.7% | $20,329 |
| 2011 | $4,233 +6.2% | $20,329 -19.1% |
| 2010 | $3,987 +9.2% | $25,135 |
| 2009 | $3,652 +13.2% | $25,135 -5% |
| 2008 | $3,227 +0.1% | $26,458 +14.8% |
| 2007 | $3,223 +3.7% | $23,056 |
| 2006 | $3,109 +6.4% | $23,056 |
| 2005 | $2,921 -2.6% | $23,056 +33.7% |
| 2004 | $3,000 +1.6% | $17,248 |
| 2003 | $2,951 +2.6% | $17,248 |
| 2002 | $2,877 +28.5% | $17,248 +23.9% |
| 2001 | $2,239 +1.7% | $13,916 |
| 2000 | $2,202 -1.1% | $13,916 |
| 1999 | $2,226 | $13,916 |
Find assessor info on the county website
Source: MRED as distributed by MLS GRID. This data may not be complete. We recommend contacting the local school district to confirm school assignments for this home.