$310,600
3 bd|1 ba|1.2k sqft
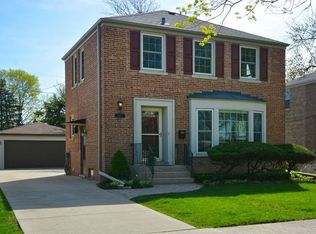
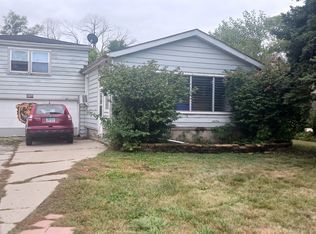
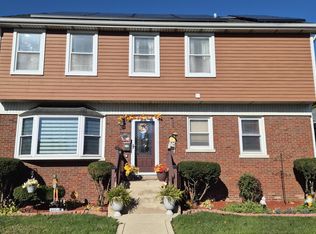
1647 Manchester Ave, Westchester, IL 60154
Off Market
Zillow last checked: 7 hours ago
Listing updated: January 22, 2026 at 09:01am
Julie Hayward, e-PRO,GRI 312-504-9228,
Edge Realty
Not available
Estimated sales range
Not available
Not available
| Date | Event | Price |
|---|---|---|
| 1/22/2026 | Contingent | $350,000$171/sqft |
Source: | ||
| 1/19/2026 | Price change | $350,000-13.6%$171/sqft |
Source: | ||
| 1/14/2026 | Listed for sale | $405,000+50.6%$198/sqft |
Source: | ||
| 5/11/2020 | Listing removed | $269,000$132/sqft |
Source: RE/MAX Action #10387142 Report a problem | ||
| 5/11/2020 | Listed for sale | $269,000+1.5%$132/sqft |
Source: RE/MAX Action #10387142 Report a problem | ||
| 5/8/2020 | Sold | $265,000-1.5%$130/sqft |
Source: | ||
| 4/3/2020 | Pending sale | $269,000$132/sqft |
Source: RE/MAX Action #10387142 Report a problem | ||
| 2/19/2020 | Listed for sale | $269,000$132/sqft |
Source: RE/MAX Action #10387142 Report a problem | ||
| 12/28/2019 | Pending sale | $269,000$132/sqft |
Source: RE/MAX Action #10387142 Report a problem | ||
| 10/3/2019 | Price change | $269,000-2.2%$132/sqft |
Source: RE/MAX Action #10387142 Report a problem | ||
| 8/20/2019 | Price change | $275,000-3.5%$135/sqft |
Source: RE/MAX Action #10387142 Report a problem | ||
| 7/31/2019 | Price change | $285,000-1.4%$139/sqft |
Source: RE/MAX Action #10387142 Report a problem | ||
| 7/8/2019 | Price change | $289,000-3.3%$141/sqft |
Source: RE/MAX Action #10387142 Report a problem | ||
| 5/21/2019 | Price change | $299,000-2%$146/sqft |
Source: RE/MAX Action #10387142 Report a problem | ||
| 5/12/2019 | Price change | $305,000-3.2%$149/sqft |
Source: RE/MAX Action #10387142 Report a problem | ||
| 4/26/2019 | Price change | $315,000-3.1%$154/sqft |
Source: RE/MAX Action #10387142 Report a problem | ||
| 4/1/2019 | Listed for sale | $325,000$159/sqft |
Source: RE/MAX Action #10326887 Report a problem | ||
| Year | Property taxes | Tax assessment |
|---|---|---|
| 2023 | $8,398 +9.7% | $32,000 +27.5% |
| 2022 | $7,655 +3.3% | $25,091 |
| 2021 | $7,410 +2.4% | $25,091 |
| 2020 | $7,239 +57.2% | $25,091 -14% |
| 2019 | $4,607 +5.6% | $29,162 |
| 2018 | $4,363 +3.8% | $29,162 |
| 2017 | $4,204 -21.6% | $29,162 +15.2% |
| 2016 | $5,363 -10.5% | $25,314 |
| 2015 | $5,993 -6.3% | $25,314 |
| 2014 | $6,397 +8.5% | $25,314 -3% |
| 2013 | $5,897 +2.6% | $26,088 |
| 2012 | $5,749 +3.3% | $26,088 |
| 2011 | $5,564 +25% | $26,088 -12% |
| 2010 | $4,450 +9% | $29,629 |
| 2009 | $4,084 +6.6% | $29,629 -5% |
| 2008 | $3,832 +0.1% | $31,188 +8% |
| 2007 | $3,828 -4.5% | $28,882 |
| 2006 | $4,008 +0.1% | $28,882 |
| 2005 | $4,003 +12.4% | $28,882 +43.6% |
| 2004 | $3,562 +1.7% | $20,117 |
| 2003 | $3,501 +2.6% | $20,117 |
| 2002 | $3,412 +12.4% | $20,117 +10.9% |
| 2001 | $3,034 +1.7% | $18,140 |
| 2000 | $2,983 -6.6% | $18,140 |
| 1999 | $3,193 | $18,140 |
Find assessor info on the county website
Source: MRED as distributed by MLS GRID. This data may not be complete. We recommend contacting the local school district to confirm school assignments for this home.