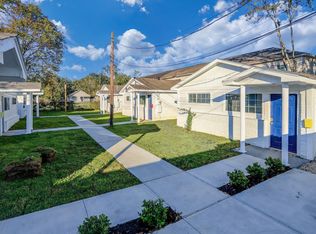
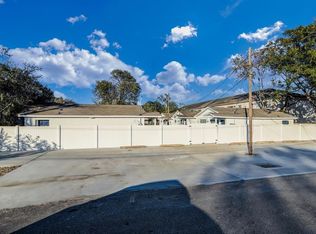
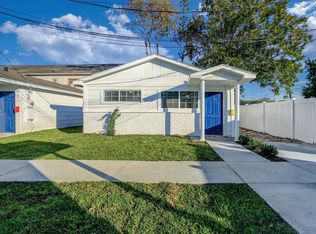
Investors opportunity. Discover this 6-plex property located in the heart of Houston. Each unit is leased, providing a steady income stream for the savvy investor. Situated in a prime location near major highways. This property offers excellent potential for continued rental growth and long-term value appreciation. All six units are thoughtfully maintained with reliable tenants already in place. Don't miss out this chance to add a high performing multifamily property to your portfolio.
For sale
Price cut: $76K (4/6)
$699,000
3823 Lydia St, Houston, TX 77021
12beds
660sqft
Multi Family
Built in 1950
-- sqft lot
$648,100 Zestimate®
$1,059/sqft
$-- HOA
What's special
- 65 days |
- 155 |
- 17 |
Zillow last checked:
Listing updated:
Listed by:
Mesut Yenice TREC #0737989 832-933-8648,
1st Brokerage
Source: HAR,MLS#: 46881657
Tour with a local agent
Facts & features
Interior
Bedrooms & bathrooms
- Bedrooms: 12
- Bathrooms: 6
- Full bathrooms: 6
Heating
- Electric, Natural Gas
Cooling
- Electric, Gas
Appliances
- Included: Range, Disposal, Dishwasher
Interior area
- Total structure area: 660
- Total interior livable area: 660 sqft
Property
Parking
- Parking features: More Than Two Parking Units
Features
- Stories: 1
- Exterior features: Balcony
Lot
- Size: 10,001 Square Feet
Details
- Parcel number: 0741510160020
Construction
Type & style
- Home type: MultiFamily
- Property subtype: Multi Family
Materials
- Roof: Other
Condition
- New construction: No
- Year built: 1950
Community & HOA
Community
- Subdivision: South End Sunnyside U/R
Location
- Region: Houston
Financial & listing details
- Price per square foot: $1,059/sqft
- Tax assessed value: $330,536
- Annual tax amount: $7,025
- Date on market: 4/6/2026
- Listing terms: Cash,Investor
- Lease term: 1 Year,Month To Month
Estimated market value
$648,100
$616,000 - $681,000
$1,312/mo
Price history
| Date | Event | Price |
|---|---|---|
| 4/6/2026 | Price change | $699,000-9.8%$1,059/sqft |
Source: | ||
| 6/16/2025 | Listing removed | $975$1/sqft |
Source: | ||
| 6/2/2025 | Price change | $975-2.5%$1/sqft |
Source: | ||
| 5/12/2025 | Listed for rent | $1,000$2/sqft |
Source: | ||
| 3/25/2025 | Price change | $775,000-3.1%$1,174/sqft |
Source: | ||
| 1/6/2025 | Listed for sale | $800,000$1,212/sqft |
Source: | ||
| 1/9/2023 | Listing removed | -- |
Source: | ||
| 12/26/2022 | Listed for sale | $800,000+5.3%$1,212/sqft |
Source: | ||
| 4/1/2022 | Listing removed | -- |
Source: | ||
| 11/15/2021 | Listed for sale | $760,000$1,152/sqft |
Source: | ||
Public tax history
| Year | Property taxes | Tax assessment |
|---|---|---|
| 2025 | $7,025 +0.8% | $330,536 -0.8% |
| 2024 | $6,971 -0.1% | $333,178 -3.8% |
| 2023 | $6,979 -8.9% | $346,388 -0.4% |
| 2022 | $7,659 | $347,824 +35.4% |
| 2021 | -- | $256,800 +42.8% |
| 2020 | $3,815 +9.4% | $179,894 +24.9% |
| 2019 | $3,487 -2.6% | $144,000 +5.5% |
| 2018 | $3,580 | $136,500 -3.7% |
| 2017 | $3,580 +17.4% | $141,700 +17.5% |
| 2016 | $3,051 -1.6% | $120,644 |
| 2015 | $3,101 | $120,644 |
| 2014 | $3,101 | $120,644 |
| 2013 | -- | $120,644 |
| 2011 | -- | $120,644 |
| 2010 | -- | $120,644 |
| 2009 | -- | $120,644 |
| 2007 | -- | $120,644 +60.9% |
| 2004 | -- | $75,000 -5.2% |
| 2003 | -- | $79,090 +11.7% |
| 2002 | -- | $70,790 |
| 2001 | -- | $70,790 +122.6% |
| 2000 | -- | $31,800 |
Find assessor info on the county website
Monthly payment
Est. payment$--/mo
Payment breakdown
Explore the cost of this home by adjusting the details. Changes won't be saved.All calculations are estimates and provided by Zillow, Inc. for informational purposes only. Actual amounts may vary.
HOA fees may include property taxes on listings classified as Co-Ops. Contact the listing agent and/or owner for fee details.
Mortgage interest rates are dependent on a number of factors, including credit score, down payment, and repayment length. Interest rate data provided by Zillow Group Marketplace, Inc. as of 1/1/1970 from various mortgage lenders with which we have lead or other similar arrangements; the Estimated Payment is an average of those rates.
See how much you could borrow to make a competitive offer.
Climate risks
Neighborhood: Ost - South Union
Nearby schools
GreatSchools rating
- 4/10Whidby Elementary SchoolGrades: PK-5Distance: 0.5 mi
- 4/10Cullen Middle SchoolGrades: 6-8Distance: 0.6 mi
- 5/10Yates High SchoolGrades: 9-12Distance: 3 mi
Schools provided by the listing agent
- Elementary: Whidby Elementary School
- Middle: Cullen Middle School (Houston)
- High: Yates High School
Source: HAR. This data may not be complete. We recommend contacting the local school district to confirm school assignments for this home.

A local agent can set up tours, give advice and negotiate with sellers.
A local lender can help you make sure your offer is ready when you are.
- Texas
- Harris County
- Houston
- 77021
- Ost - South Union
- 3823 Lydia St
Nearby cities
Nearby neighborhoods
Nearby zip codes
Other Houston Topics
