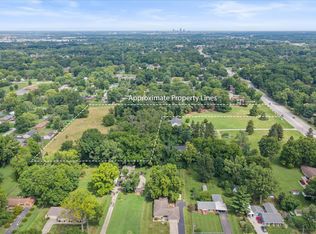
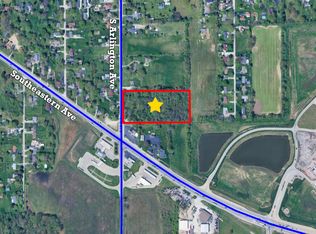
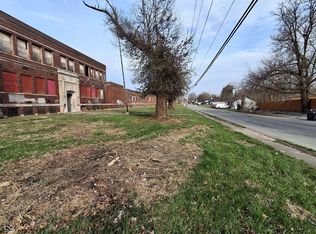
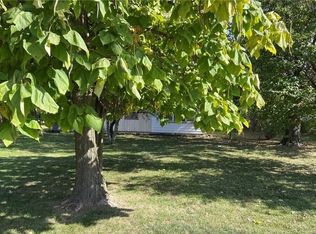
4 acre hard corner development lot. Southside Indy location is less than 5 minutes to downtown. Preliminary rezoning discussions with the City of Indianapolis suggest retail development of C-3, Multi-family or Mixed use applications. Property is slightly below floodplain (less than a foot) retention pond development will account for the fill needed to raise future development "out of" the flood zone.
Active
$799,000
3901 Bluff Rd, Indianapolis, IN 46217
--beds
--baths
3.97Acres
Unimproved Land
Built in ----
3.97 Acres Lot
$-- Zestimate®
$--/sqft
$-- HOA
What's special
- 460 days |
- 92 |
- 4 |
Zillow last checked: 7 hours ago
Listing updated: December 20, 2025 at 12:52pm
Listing Provided by:
Dean Ehrgott 317-223-1186,
Tower 1 Realty
Source: MIBOR as distributed by MLS GRID,MLS#: 22016606
Facts & features
Property
Lot
- Size: 3.97 Acres
- Features: City, Corner
- Topography: Cleared,Flood Plain,Level
Details
- Parcel number: 491126102097000500
- Zoning: D-A
- Zoning description: Agricultur
- Horse amenities: None
Utilities & green energy
- Water: Municipal Water Near By
Community & HOA
Community
- Subdivision: No Subdivision
Location
- Region: Indianapolis
Financial & listing details
- Tax assessed value: $7,800
- Annual tax amount: $166
- Date on market: 1/3/2025
- Cumulative days on market: 824 days
- Road surface type: Asphalt
Estimated market value
Not available
Estimated sales range
Not available
$1,296/mo
Price history
Price history
| Date | Event | Price |
|---|---|---|
| 12/20/2025 | Listed for sale | $799,000 |
Source: | ||
Public tax history
Public tax history
| Year | Property taxes | Tax assessment |
|---|---|---|
| 2024 | $165 +24.3% | $7,800 +20% |
| 2023 | $133 +16.5% | $6,500 +25% |
| 2022 | $114 -0.6% | $5,200 +18.2% |
| 2021 | $115 -19% | $4,400 |
| 2020 | $142 -52.1% | $4,400 -18.5% |
| 2019 | $296 -13.1% | $5,400 -52.6% |
| 2018 | $341 -5.9% | $11,400 -13% |
| 2017 | $362 -1.3% | $13,100 -5.8% |
| 2016 | $367 +4.4% | $13,900 -4.1% |
| 2014 | $352 +24.1% | $14,500 +16% |
| 2013 | $283 | $12,500 +7.8% |
| 2012 | $283 | $11,600 +9.4% |
| 2011 | -- | $10,600 +16.5% |
| 2010 | $182 +3.4% | $9,100 +3.4% |
| 2009 | $176 | $8,800 |
Find assessor info on the county website
Monthly payment
Estimated monthly payment
All calculations are estimates and provided by Zillow, Inc. for informational purposes only. Actual amounts may vary.
HOA fees may include property taxes on listings classified as Co-Ops. Contact the listing agent and/or owner for fee details.
Mortgage interest rates are dependent on a number of factors, including credit score, down payment, and repayment length. Interest rate data provided by Zillow Group Marketplace, Inc. as of 1/1/1970 from various mortgage lenders with which we have lead or other similar arrangements; the Estimated Payment is an average of those rates.
See how much you could borrow to make a competitive offer.
Climate risks
Neighborhood: North Perry
Nearby schools
GreatSchools rating
- 5/10Abraham Lincoln Elementary SchoolGrades: PK-5Distance: 1.3 mi
- 7/10Perry Meridian Middle SchoolGrades: 7-8Distance: 4 mi
- 9/10Perry Meridian High SchoolGrades: 9-12Distance: 4.1 mi
Local experts in 46217
- Indiana
- Marion County
- Indianapolis
- 46217
- North Perry
- 3901 Bluff Rd
Nearby cities
Nearby neighborhoods
Nearby zip codes
Other Indianapolis Topics
