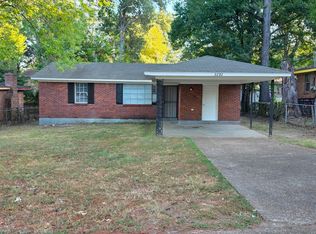
Investor Opportunity! Whether you're looking to renovate, add to your rental portfolio, or explore resale potential, this property offers an opportunity to put your vision to work. Great potential for investors or buyers looking for their next project.
For sale
$124,000
3909 Range Line Rd, Memphis, TN 38127
3beds
1,071sqft
Single Family Residence
Built in 1965
10,454 Square Feet Lot
$120,700 Zestimate®
$116/sqft
$-- HOA
What's special
- 1 day
- 59
- 15
Likely to sell faster than
Zillow last checked:
Listing updated:
Listed by:
Crystal Mitchell,
Renshaw Company, REALTORS 901-820-4367
Source: MAAR,MLS#: 10234473
Facts & features
Interior
Bedrooms & bathrooms
- Bedrooms: 3
- Bathrooms: 1
- Full bathrooms: 1
Primary bedroom
- Dimensions: 0 x 0
Dining room
- Dimensions: 0 x 0
Living room
- Features: Separate Living Room
- Dimensions: 0 x 0
Den
- Dimensions: 0 x 0
Heating
- Natural Gas
Cooling
- Central Air
Features
- All Bedrooms Down, Square Feet Source: AutoFill (MAARdata) or Public Records (Cnty Assessor Site)
- Flooring: Hardwood
- Has fireplace: No
Interior area
- Total interior livable area: 1,071 sqft
Property
Parking
- Total spaces: 1
- Parking features: Driveway/Pad
- Covered spaces: 1
- Has uncovered spaces: Yes
Features
- Stories: 1
- Pool features: None
- Fencing: Chain Fence
Lot
- Size: 10,454 Square Feet
- Dimensions: 84 x 120
- Features: Level
Details
- Parcel number: 072103 00005
Construction
Type & style
- Home type: SingleFamily
- Architectural style: Traditional
- Property subtype: Single Family Residence
Materials
- Brick Veneer
Condition
- New construction: No
- Year built: 1965
Community & HOA
Community
- Subdivision: Brookmeade Park
Location
- Region: Memphis
Financial & listing details
- Price per square foot: $116/sqft
- Tax assessed value: $84,600
- Annual tax amount: $1,115
- Price range: $124K - $124K
- Date on market: 11/17/2026
- Cumulative days on market: 2 days
Estimated market value
$120,700
$115,000 - $127,000
$1,121/mo
Price history
| Date | Event | Price |
|---|---|---|
| 11/17/2026 | Listed for sale | $124,000+12.7%$116/sqft |
Source:  MAAR #10234473 Report a problem | ||
| 6/2/2026 | Listed for rent | $1,195$1/sqft |
Source: Zillow Rentals Report a problem | ||
| 4/15/2026 | Sold | $110,000-15.4%$103/sqft |
Source: Public Record Report a problem | ||
| 1/12/2026 | Price change | $130,000-1.9%$121/sqft |
Source: MAAR #10202127 Report a problem | ||
| 10/4/2025 | Price change | $132,500-1.9%$124/sqft |
Source: MAAR #10202127 Report a problem | ||
| 7/26/2025 | Listed for sale | $135,000+29.8%$126/sqft |
Source: MAAR #10202127 Report a problem | ||
| 3/23/2024 | Sold | $104,000-14.8%$97/sqft |
Source: MAAR #10155029 Report a problem | ||
| 2/27/2024 | Pending sale | $122,000$114/sqft |
Source: MAAR #10155029 Report a problem | ||
| 12/20/2023 | Price change | $122,000-2.4%$114/sqft |
Source: MAAR #10155029 Report a problem | ||
| 10/17/2023 | Listed for sale | $125,000$117/sqft |
Source: MAAR #10155029 Report a problem | ||
| 8/30/2023 | Listing removed | -- |
Source: MAAR #10155029 Report a problem | ||
| 8/23/2023 | Listed for sale | $125,000$117/sqft |
Source: MAAR #10155029 Report a problem | ||
Public tax history
| Year | Property taxes | Tax assessment |
|---|---|---|
| 2025 | $1,115 +31.5% | $21,150 +64.3% |
| 2024 | $848 +8.1% | $12,875 |
| 2023 | $784 | $12,875 |
| 2022 | -- | $12,875 |
| 2021 | -- | $12,875 +17.3% |
| 2020 | $351 | $10,975 |
| 2019 | $351 -21.1% | $10,975 |
| 2018 | $444 -45.1% | $10,975 |
| 2017 | $810 +121.7% | $10,975 +2.1% |
| 2016 | $365 -17.4% | $10,750 |
| 2014 | $442 | $10,750 |
| 2013 | -- | $10,750 -22.5% |
| 2012 | -- | $13,875 |
| 2011 | -- | $13,875 |
| 2010 | -- | $13,875 |
| 2009 | -- | $13,875 +3.4% |
| 2008 | -- | $13,425 |
| 2007 | -- | $13,425 |
| 2006 | -- | $13,425 |
| 2005 | -- | $13,425 +14.7% |
| 2004 | -- | $11,700 |
| 2003 | -- | $11,700 |
| 2002 | -- | $11,700 |
| 2001 | -- | $11,700 +5.6% |
| 2000 | -- | $11,075 |
Find assessor info on the county website
Monthly payment
Est. payment
Payment breakdown
Explore the cost of this home by adjusting the details. Changes won't be saved.Climate risks
Neighborhood: Shelby Forest-Frayser

Similar homes
- $125,0003 bd1 ba989 sqft2175 Stephanie Ave, Memphis, TN 38127For Sale
 MLS ID #10228416, Caleb Parr, Renshaw Company, REALTORS. MAAR
- $129,9003 bd1 ba971 sqft2282 Arlene Ave, Memphis, TN 38127For Sale
 MLS ID #10229398, Dean Harris, CrestCore Realty MphsBrokerage. MAAR
- $109,9003 bd2 ba1.2k sqft3491 Hallbrook St, Memphis, TN 38127For Sale
 MLS ID #10232229, Crystal R Mitchell, Crye-Leike Inc., REALTORS. MAAR
- $112,5003 bd2 ba1k sqft1675 Haywood Ave, Memphis, TN 38127For Sale
 MLS ID #10220762, Tyler Tapley, Crye-Leike, Inc., REALTORS. MAAR
