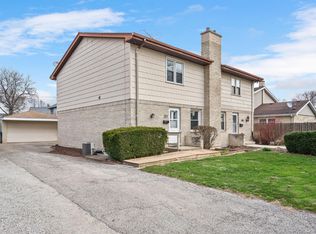
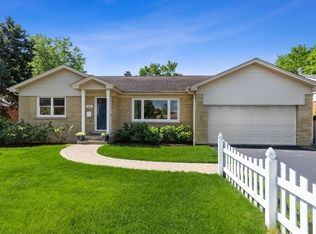
$633,100
3 bd|3 ba|2.2k sqft
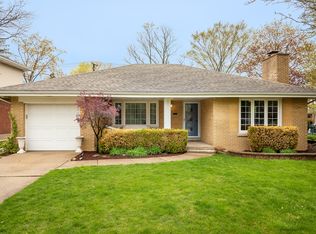
398 E Saint Charles Rd, Elmhurst, IL 60126
Off Market
Likely to sell faster than
Zillow last checked:
Listing updated:
Kelly Stetler 630-750-9551,
Compass,
Christina Corso 815-922-0459,
Compass
$535,100
$508,000 - $562,000
$4,567/mo
| Date | Event | Price |
|---|---|---|
| 5/20/2026 | Listing removed | $535,000$328/sqft |
Source: | ||
| 4/22/2026 | Listed for sale | $535,000-2.7%$328/sqft |
Source: | ||
| 4/22/2026 | Listing removed | $550,000$337/sqft |
Source: | ||
| 4/9/2026 | Listed for sale | $550,000+40.1%$337/sqft |
Source: | ||
| 12/2/2016 | Sold | $392,500-1.6%$240/sqft |
Source: | ||
| 8/24/2016 | Pending sale | $399,000$244/sqft |
Source: L.W. Reedy Real Estate #09306588 Report a problem | ||
| 8/4/2016 | Listed for sale | $399,000+98418.5%$244/sqft |
Source: L.W. Reedy Real Estate #09306588 Report a problem | ||
| 6/28/2011 | Listing removed | $405 |
Source: POPULAR REALTY GROUP #06557984 Report a problem | ||
| 4/8/2011 | Listed for sale | $405-99.8% |
Source: POPULAR REALTY GROUP #06557984 Report a problem | ||
| 5/12/2009 | Sold | $240,000-19.7%$147/sqft |
Source: | ||
| 12/28/2004 | Sold | $299,000+22.5%$183/sqft |
Source: Public Record Report a problem | ||
| 10/7/2004 | Sold | $244,000$149/sqft |
Source: Public Record Report a problem | ||
| Year | Property taxes | Tax assessment |
|---|---|---|
| 2024 | $10,310 +7.8% | $179,080 +8.1% |
| 2023 | $9,568 +3% | $165,600 +4% |
| 2022 | $9,289 +2.6% | $159,190 +2.6% |
| 2021 | $9,058 +4% | $155,230 +2.2% |
| 2020 | $8,707 +2.2% | $151,830 +5.2% |
| 2019 | $8,522 +13% | $144,350 +13% |
| 2018 | $7,541 +2.3% | $127,730 +4.9% |
| 2017 | $7,373 +2.2% | $121,720 +6.1% |
| 2016 | $7,214 +1.1% | $114,670 +7.3% |
| 2015 | $7,136 -15.3% | $106,830 -7.4% |
| 2014 | $8,425 +1.1% | $115,330 -1.4% |
| 2013 | $8,335 +2.4% | $116,960 -6.2% |
| 2012 | $8,139 +4.8% | $124,650 -7.9% |
| 2011 | $7,763 +2.1% | $135,340 -6.8% |
| 2010 | $7,603 +4% | $145,240 -6.8% |
| 2009 | $7,310 +6% | $155,830 |
| 2008 | $6,893 +5% | $155,830 +8.8% |
| 2007 | $6,568 +8.2% | $143,230 +13.2% |
| 2006 | $6,069 -0.3% | $126,560 +6.9% |
| 2005 | $6,089 +10.2% | $118,390 +6.3% |
| 2004 | $5,527 +2.3% | $111,370 +4% |
| 2003 | $5,403 +5.2% | $107,050 +13.2% |
| 2002 | $5,137 +7% | $94,600 +8.7% |
| 2001 | $4,799 +3.3% | $86,990 +5.2% |
| 2000 | $4,645 | $82,690 |
Find assessor info on the county website
Source: MRED as distributed by MLS GRID. This data may not be complete. We recommend contacting the local school district to confirm school assignments for this home.
A local agent can set up tours, give advice and negotiate with sellers.
A local lender can help you make sure your offer is ready when you are.