One level brick three-bedroom one bath with a little TLC will make this home the perfect first home or investment property. Take a look for yourself!
Active
$132,000
3943 Richelieu Rd, Indianapolis, IN 46226
3beds
999sqft
Residential, Single Family Residence
Built in 1961
6,969 Square Feet Lot
$-- Zestimate®
$132/sqft
$-- HOA
What's special
One bathOne level brick
- 10 days
- 140
- 6
Likely to sell faster than
Zillow last checked:
Listing updated:
Listed by:
Eric Middleton eric@middland.net,
Middland Real Estate, LLC
Source: MIBOR as distributed by MLS GRID,MLS#: 22132562
Facts & features
Interior
Bedrooms & bathrooms
- Bedrooms: 3
- Bathrooms: 1
- Full bathrooms: 1
- Main level bathrooms: 1
- Main level bedrooms: 3
Primary bedroom
- Level: Main
- Area: 140 Square Feet
- Dimensions: 14x10
Bedroom 2
- Level: Main
- Area: 110 Square Feet
- Dimensions: 11x10
Bedroom 3
- Level: Main
- Area: 90 Square Feet
- Dimensions: 10x9
Dining room
- Level: Main
- Area: 120 Square Feet
- Dimensions: 10x12
Kitchen
- Level: Main
- Area: 84 Square Feet
- Dimensions: 12x7
Living room
- Level: Main
- Area: 182 Square Feet
- Dimensions: 13x14
Heating
- Forced Air
Cooling
- Central Air
Appliances
- Included: Gas Cooktop, Refrigerator
Features
- Eat-in Kitchen
- Has basement: No
Interior area
- Total structure area: 999
- Total interior livable area: 999 sqft
Property
Features
- Levels: One
- Stories: 1
Lot
- Size: 6,969 Square Feet
Details
- Parcel number: 490818105030000401
- Special conditions: As Is,In Foreclosure
- Horse amenities: None
Construction
Type & style
- Home type: SingleFamily
- Architectural style: Traditional
- Property subtype: Residential, Single Family Residence
Materials
- Brick
- Foundation: Slab
Condition
- New construction: No
- Year built: 1961
Utilities & green energy
- Water: Public
Community & HOA
Community
- Subdivision: Beacon Heights
HOA
- Has HOA: No
Location
- Region: Indianapolis
Financial & listing details
- Price per square foot: $132/sqft
- Tax assessed value: $124,200
- Annual tax amount: $1,214
- Date on market: 10/21/2026
- Cumulative days on market: 12 days
Estimated market value
Not available
Estimated sales range
Not available
Not available
Price history
| Date | Event | Price |
|---|---|---|
| 9/14/2023 | Sold | $118,000+2.6%$118/sqft |
Source:  MIBOR as distributed by MLS GRID #21911215 Report a problem | ||
| 7/18/2023 | Pending sale | $115,000$115/sqft |
Source: MIBOR as distributed by MLS GRID #21911215 Report a problem | ||
| 7/13/2023 | Listed for sale | $115,000$115/sqft |
Source: MIBOR as distributed by MLS GRID #21911215 Report a problem | ||
| 5/5/2023 | Pending sale | $115,000$115/sqft |
Source: MIBOR as distributed by MLS GRID #21911215 Report a problem | ||
| 4/27/2023 | Listed for sale | $115,000$115/sqft |
Source: MIBOR as distributed by MLS GRID #21911215 Report a problem | ||
| 3/25/2023 | Pending sale | $115,000$115/sqft |
Source: MIBOR as distributed by MLS GRID #21911215 Report a problem | ||
| 3/19/2023 | Listed for sale | $115,000+74.4%$115/sqft |
Source: MIBOR as distributed by MLS GRID #21911215 Report a problem | ||
| 3/16/2023 | Listing removed | -- |
Source: Zillow Rentals Report a problem | ||
| 12/27/2022 | Listed for rent | $895$1/sqft |
Source: Zillow Rentals Report a problem | ||
| 7/3/2020 | Listing removed | $895$1/sqft |
Source: HomeRiver Group Report a problem | ||
| 6/26/2020 | Listed for rent | $895+14%$1/sqft |
Source: Zillow Rental Network Premium Report a problem | ||
| 12/13/2017 | Sold | $65,950+153.7%$66/sqft |
Source: Public Record Report a problem | ||
| 9/2/2014 | Listing removed | $785$1/sqft |
Source: Brick Lane Property Management Report a problem | ||
| 6/1/2014 | Listed for rent | $785$1/sqft |
Source: Brick Lane Property Management Report a problem | ||
| 3/28/2014 | Sold | $26,000-9.5%$26/sqft |
Source: MIBOR as distributed by MLS GRID #21270795 Report a problem | ||
| 2/26/2014 | Pending sale | $28,737$29/sqft |
Source: Ala Carte Realty #21270795 Report a problem | ||
| 1/11/2014 | Listed for sale | $28,737$29/sqft |
Source: Ala Carte Realty, LLC #21270795 Report a problem | ||
Public tax history
| Year | Property taxes | Tax assessment |
|---|---|---|
| 2025 | $852 +82.9% | $124,200 +26.1% |
| 2024 | $466 -70.7% | $98,500 +36% |
| 2023 | $1,589 +42% | $72,400 +7.6% |
| 2022 | $1,119 +10.8% | $67,300 +38.8% |
| 2021 | $1,010 -2.2% | $48,500 +11.2% |
| 2020 | $1,032 -0.9% | $43,600 -0.2% |
| 2019 | $1,042 -22.1% | $43,700 |
| 2018 | $1,337 +48.2% | $43,700 +6.6% |
| 2017 | $903 -0.1% | $41,000 +3% |
| 2016 | $904 +3.4% | $39,800 -1.5% |
| 2014 | $874 -36.2% | $40,400 -35.4% |
| 2013 | $1,369 | $62,500 +2.5% |
| 2012 | $1,369 | $61,000 -5.4% |
| 2011 | -- | $64,500 |
| 2010 | $1,342 +13.4% | $64,500 +16.2% |
| 2009 | $1,184 | $55,500 +7.1% |
| 2007 | -- | $51,800 |
Find assessor info on the county website
Monthly payment
Est. payment
Payment breakdown
Explore the cost of this home by adjusting the details. Changes won't be saved.Climate risks
Neighborhood: Far Eastside
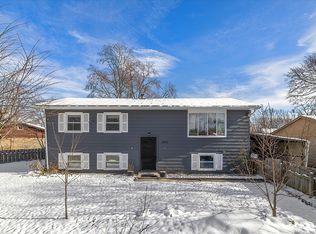
Similar homes
- $134,5003 bd1 ba1.2k sqft3921 Malibu Dr, Indianapolis, IN 46226Active
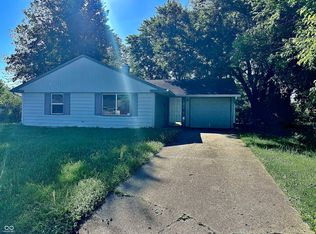 MLS ID #22109124, Ashley Marino, Berkshire Hathaway HomeServices. MIBOR as distributed by MLS GRID
- $150,0003 bd2 ba1k sqft3233 N Ashland Ave, Indianapolis, IN 46226Active
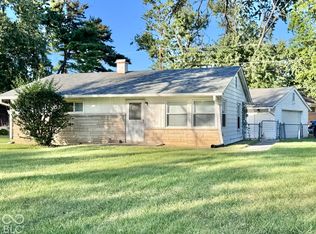 MLS ID #22128638, Rebecca Hameda, The Stewart Home Group. MIBOR as distributed by MLS GRID
- $115,0003 bd1 ba925 sqft8446 E 36th Pl, Indianapolis, IN 46226Active
 MLS ID #22127399, Banessa Lara, AMR Real Estate LLC. MIBOR as distributed by MLS GRID
- $157,0003 bd2 ba1k sqft4209 Lesley Ave, Indianapolis, IN 46226Active
 MLS ID #22124705, Ramsui Thawnger, CrossRoads Link Realty. MIBOR as distributed by MLS GRID
