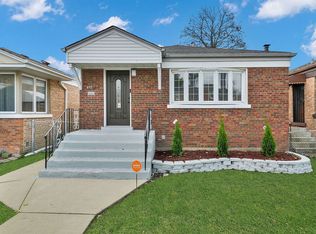
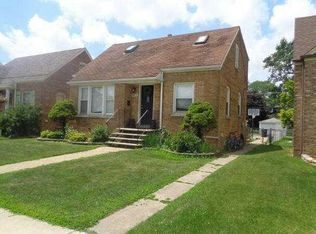
$252,100
3 bd1 ba1.1k sqft
3114 W Columbus Ave, Chicago, IL 60652
Off Market
Zillow last checked:
Listing updated:
Ernestina Preciado 630-235-3216,
RE/MAX 10,
Kassandra Yousef 708-203-3308,
RE/MAX 10

Not available
Estimated sales range
Not available
Not available
| Date | Event | Price |
|---|---|---|
| 11/22/2026 | Listed for sale | $325,000-4.1%$146/sqft |
Source:  MRED as distributed by MLS GRID #12813573 Report a problem | ||
| 11/21/2026 | Listing removed | $339,000$153/sqft |
Source: MRED as distributed by MLS GRID #12681037 Report a problem | ||
| 10/30/2026 | Price change | $339,000+3%$153/sqft |
Source: MRED as distributed by MLS GRID #12681037 Report a problem | ||
| 6/30/2026 | Pending sale | $329,000$148/sqft |
Source: MRED as distributed by MLS GRID #12681037 Report a problem | ||
| 6/17/2026 | Listed for sale | $329,000+448.3%$148/sqft |
Source: MRED as distributed by MLS GRID #12681037 Report a problem | ||
| 1/24/2013 | Sold | $60,000+5.3%$27/sqft |
Source: MRED as distributed by MLS GRID #07911899 Report a problem | ||
| 9/20/2012 | Price change | $57,000-18.5%$26/sqft |
Source: Remax 10 #07911899 Report a problem | ||
| 8/31/2012 | Pending sale | $69,900$31/sqft |
Source: Remax 10 #07911899 Report a problem | ||
| 12/7/2011 | Price change | $69,900-12.5%$31/sqft |
Source: Remax 10 #07911899 Report a problem | ||
| 11/29/2011 | Price change | $79,900-5.9%$36/sqft |
Source: Remax 10 #07911899 Report a problem | ||
| 11/15/2011 | Price change | $84,900-10.5%$38/sqft |
Source: Remax 10 #07911899 Report a problem | ||
| 11/1/2011 | Price change | $94,900-5%$43/sqft |
Source: Remax 10 #07911899 Report a problem | ||
| 10/25/2011 | Price change | $99,900-4.9%$45/sqft |
Source: Remax 10 #07911899 Report a problem | ||
| 10/19/2011 | Price change | $105,000-3.7%$47/sqft |
Source: Remax 10 #07911899 Report a problem | ||
| 10/7/2011 | Price change | $109,000-8.4%$49/sqft |
Source: Remax 10 #07911899 Report a problem | ||
| 9/27/2011 | Listed for sale | $119,000-22.2%$54/sqft |
Source: Remax 10 #07911899 Report a problem | ||
| 4/6/2004 | Sold | $152,900$69/sqft |
Source: Public Record Report a problem | ||
| Year | Property taxes | Tax assessment |
|---|---|---|
| 2024 | $4,045 +11.9% | $20,000 +17.6% |
| 2023 | $3,613 +2.6% | $17,000 |
| 2022 | $3,523 +2.3% | $17,000 |
| 2021 | $3,446 +23.3% | $17,000 +36.7% |
| 2020 | $2,795 -0.2% | $12,437 -10% |
| 2019 | $2,800 +1.7% | $13,819 |
| 2018 | $2,753 -6.8% | $13,819 +1.6% |
| 2017 | $2,955 +7.5% | $13,602 |
| 2016 | $2,749 +9.2% | $13,602 |
| 2015 | $2,516 +6.8% | $13,602 +8.1% |
| 2014 | $2,357 +2% | $12,578 |
| 2013 | $2,311 +1.3% | $12,578 |
| 2012 | $2,280 -15.3% | $12,578 -23.6% |
| 2011 | $2,691 -0.5% | $16,464 |
| 2010 | $2,704 +4.3% | $16,464 |
| 2009 | $2,592 -5.2% | $16,464 -12.8% |
| 2008 | $2,733 +1% | $18,879 |
| 2007 | $2,707 -1% | $18,879 |
| 2006 | $2,735 +28.8% | $18,879 +46.6% |
| 2005 | $2,123 +1% | $12,875 |
| 2004 | $2,101 +45.3% | $12,875 |
| 2003 | $1,446 -5.4% | $12,875 +25.5% |
| 2002 | $1,529 +6.2% | $10,259 |
| 2001 | $1,439 +5.3% | $10,259 |
| 2000 | $1,366 +0.3% | $10,259 +13.4% |
| 1999 | $1,362 | $9,048 |
Source: MRED as distributed by MLS GRID. This data may not be complete. We recommend contacting the local school district to confirm school assignments for this home.

A local agent can set up tours, give advice and negotiate with sellers.