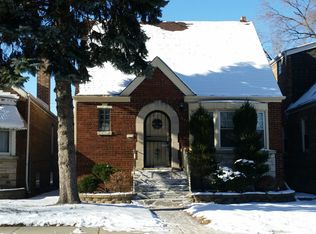
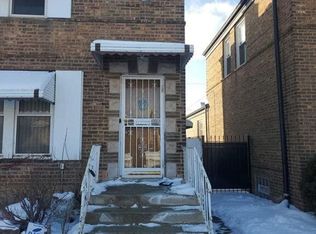
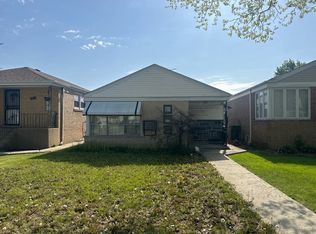
This 1224 square foot single family home has 3 bedrooms and 2.0 bathrooms. This home is located at 7948 S Maplewood Ave, Chicago, IL 60652.
Foreclosed
Est. $304,200
7948 S Maplewood Ave, Chicago, IL 60652
3beds
1,224sqft
SingleFamily
Built in 1952
3,484 Square Feet Lot
$304,200 Zestimate®
$249/sqft
$-- HOA
Overview
- 260 days |
- 72 |
- 3 |
Facts & features
Interior
Bedrooms & bathrooms
- Bedrooms: 3
- Bathrooms: 2
- Full bathrooms: 2
Heating
- Forced air, Gas
Cooling
- Central
Appliances
- Included: Dishwasher, Microwave, Range / Oven, Refrigerator
Features
- Flooring: Tile, Carpet, Hardwood
- Has fireplace: Yes
Interior area
- Total interior livable area: 1,224 sqft
Property
Parking
- Parking features: Garage - Attached
Features
- Exterior features: Brick
Lot
- Size: 3,484 Square Feet
Details
- Parcel number: 1936204030
Construction
Type & style
- Home type: SingleFamily
Materials
- Roof: Asphalt
Condition
- Year built: 1952
Community & HOA
Location
- Region: Chicago
Financial & listing details
- Price per square foot: $249/sqft
- Tax assessed value: $180,000
- Annual tax amount: $3,826
Visit our professional directory to find a foreclosure specialist in your area that can help with your home search.
Find a foreclosure agentForeclosure details
Estimated market value
$304,200
$289,000 - $319,000
$2,420/mo
Price history
Price history
| Date | Event | Price |
|---|---|---|
| 9/3/2021 | Sold | $260,000+6.1%$212/sqft |
Source: | ||
| 7/21/2021 | Pending sale | $245,000$200/sqft |
Source: | ||
| 7/13/2021 | Listed for sale | $245,000+33.2%$200/sqft |
Source: | ||
| 5/5/2017 | Sold | $184,000-1.3%$150/sqft |
Source: | ||
| 3/16/2017 | Pending sale | $186,500$152/sqft |
Source: American International Realty #09512545 Report a problem | ||
| 2/27/2017 | Price change | $186,500-0.2%$152/sqft |
Source: American International Realty #09512545 Report a problem | ||
| 12/22/2016 | Pending sale | $186,800$153/sqft |
Source: American International Realty #09349406 Report a problem | ||
| 11/30/2016 | Listed for sale | $186,800$153/sqft |
Source: American International Realty #09349406 Report a problem | ||
| 11/22/2016 | Pending sale | $186,800$153/sqft |
Source: American International Realty #09349406 Report a problem | ||
| 10/19/2016 | Price change | $186,800-1.6%$153/sqft |
Source: American International Realty #09349406 Report a problem | ||
| 9/22/2016 | Listed for sale | $189,900+165.6%$155/sqft |
Source: American International Realty #09349406 Report a problem | ||
| 7/14/2016 | Sold | $71,500+4.1%$58/sqft |
Source: Public Record Report a problem | ||
| 5/21/2016 | Price change | -- |
Source: Owners.com #09223515 Report a problem | ||
| 5/13/2016 | Listed for sale | $68,700$56/sqft |
Source: REALHome Services and Solutions #09223515 Report a problem | ||
Public tax history
Public tax history
| Year | Property taxes | Tax assessment |
|---|---|---|
| 2023 | $3,826 +2.6% | $18,000 |
| 2022 | $3,731 +25.5% | $18,000 |
| 2021 | $2,973 +18.4% | $18,000 +26.1% |
| 2020 | $2,511 -0.3% | $14,275 -10% |
| 2019 | $2,519 +1.7% | $15,862 |
| 2018 | $2,476 -10.8% | $15,862 +24.2% |
| 2017 | $2,775 +33.6% | $12,775 |
| 2016 | $2,077 +10.6% | $12,775 |
| 2015 | $1,878 -15.6% | $12,775 -11.5% |
| 2014 | $2,225 +2.5% | $14,440 |
| 2013 | $2,170 +0.2% | $14,440 |
| 2012 | $2,166 +3.9% | $14,440 -12.7% |
| 2011 | $2,084 +8.5% | $16,543 |
| 2010 | $1,920 +15% | $16,543 |
| 2009 | $1,670 +11.1% | $16,543 -13.7% |
| 2008 | $1,503 +3.2% | $19,180 |
| 2007 | $1,457 +0.8% | $19,180 |
| 2006 | $1,445 -5.1% | $19,180 +44% |
| 2005 | $1,523 +1.9% | $13,319 |
| 2004 | $1,494 +4.5% | $13,319 |
| 2003 | $1,430 -5.4% | $13,319 +31% |
| 2002 | $1,512 +6.3% | $10,167 |
| 2001 | $1,423 +7.5% | $10,167 |
| 2000 | $1,324 +0.3% | $10,167 +15.2% |
| 1999 | $1,320 | $8,829 |
Find assessor info on the county website
Monthly payment
Estimated monthly payment
All calculations are estimates and provided by Zillow, Inc. for informational purposes only. Actual amounts may vary.
HOA fees may include property taxes on listings classified as Co-Ops. Contact the listing agent and/or owner for fee details.
Mortgage interest rates are dependent on a number of factors, including credit score, down payment, and repayment length. Interest rate data provided by Zillow Group Marketplace, Inc. as of 1/1/1970 from various mortgage lenders with which we have lead or other similar arrangements; the Estimated Payment is an average of those rates.
See how much you could borrow to make a competitive offer.
Climate risks
Neighborhood: Wrightwood
Nearby schools
GreatSchools rating
- 7/10Carroll Elementary SchoolGrades: PK-8Distance: 0.7 mi
- 2/10Bogan High SchoolGrades: 9-12Distance: 1.8 mi
- Illinois
- Cook County
- Chicago
- 60652
- Wrightwood
- 7948 S Maplewood Ave
Nearby cities
Nearby neighborhoods
Nearby zip codes
Other Chicago Topics
