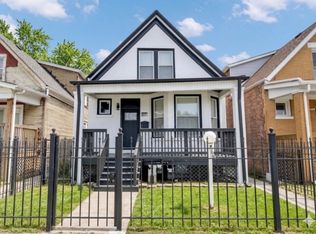
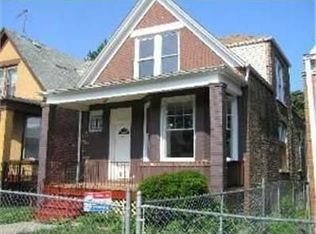
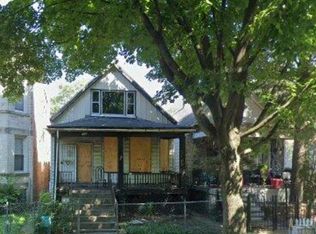
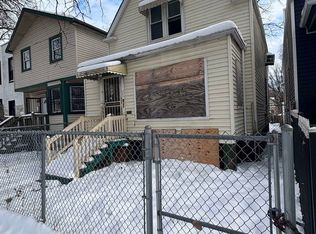
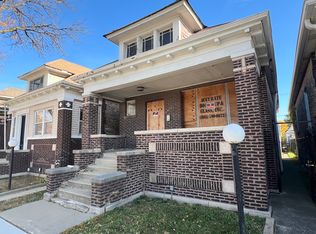
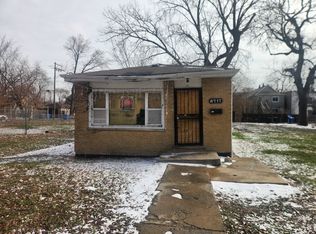
The auction for this Hubzu property ends 02-19-2026 at 01:00 PM ET. Why wait? Bid on this property now. Visit Hubzu to get started. CWCOT marketing description: Great Opportunity to own this single-family home oozing with potential. This home was built in 1921 and features 4 bedrooms and 2 bathrooms. ***SPECIAL NOTES: (1) This is a CASH ONLY transaction. (2) Seller to pay Taxes, HOA, and Municipal/Utility Liens. (3) Please read the Auction disclaimers carefully before placing a bid or submitting an offer. ***
Pending
Price cut: $5.5K (2/20)
Est. $66,000
6603 S Oakley Ave, Chicago, IL 60636
4beds
2baths
1,499sqft
Single Family Residence
Built in 1921
-- sqft lot
$-- Zestimate®
$44/sqft
$-- HOA
Overview
- 43 days |
- 8 |
- 0 |
Zillow last checked: April 03, 2026 at 12:13am
Source: Hubzu Zillow Review,MLS#: 92517648611AUCN1
Facts & features
Interior
Bedrooms & bathrooms
- Bedrooms: 4
- Bathrooms: 2
Features
- Has basement: No
Interior area
- Total structure area: 1,499
- Total interior livable area: 1,499 sqft
Property
Details
- Parcel number: 2019125002
Construction
Type & style
- Home type: SingleFamily
- Property subtype: Single Family Residence
Condition
- Year built: 1921
Community & HOA
Location
- Region: Chicago
Financial & listing details
- Price per square foot: $44/sqft
- Tax assessed value: $44,990
- Annual tax amount: $251
- Date on market: 2/20/2026
- Lease term: Contact For Details
Foreclosure details
Estimated market value
Not available
Estimated sales range
Not available
$2,217/mo
Price history
Price history
| Date | Event | Price |
|---|---|---|
| 2/20/2026 | Pending sale | $66,000-7.7%$44/sqft |
Source: Hubzu Zillow Review #92517648611AUCN1 Report a problem | ||
| 2/1/2026 | Listed for sale | $71,500-61.4%$48/sqft |
Source: | ||
| 2/8/2025 | Listing removed | $185,000$123/sqft |
Source: | ||
| 3/17/2024 | Price change | $185,000+32.1%$123/sqft |
Source: | ||
| 3/7/2024 | Pending sale | $140,000$93/sqft |
Source: | ||
| 2/13/2024 | Listed for sale | $140,000+55.7%$93/sqft |
Source: | ||
| 12/1/2023 | Listing removed | -- |
Source: | ||
| 8/8/2023 | Listed for sale | $89,900$60/sqft |
Source: | ||
| 4/9/2023 | Pending sale | $89,900$60/sqft |
Source: | ||
| 4/2/2023 | Price change | $89,900-11.1%$60/sqft |
Source: | ||
| 3/7/2023 | Price change | $101,150-15%$67/sqft |
Source: | ||
| 1/30/2023 | Listed for sale | $119,000-14.4%$79/sqft |
Source: | ||
| 12/23/2021 | Listing removed | -- |
Source: | ||
| 1/7/2021 | Price change | $139,000-6.7%$93/sqft |
Source: P2K Realty #10958908 Report a problem | ||
| 12/27/2020 | Listed for sale | $149,000+56.8%$99/sqft |
Source: P2K Realty #10958908 Report a problem | ||
| 7/30/2014 | Sold | $95,000+859.6%$63/sqft |
Source: Public Record Report a problem | ||
| 6/3/2014 | Listing removed | $1,200$1/sqft |
Source: Real People Realty Inc #08596895 Report a problem | ||
| 4/27/2014 | Listed for rent | $1,200$1/sqft |
Source: Real People Realty Inc #08596895 Report a problem | ||
| 7/15/2011 | Sold | $9,900$7/sqft |
Source: | ||
| 6/9/2011 | Listed for sale | $9,900-88.2%$7/sqft |
Source: foreclosure.com Report a problem | ||
| 12/7/2004 | Sold | $84,000+166.7%$56/sqft |
Source: Public Record Report a problem | ||
| 2/10/1999 | Sold | $31,500$21/sqft |
Source: Public Record Report a problem | ||
Public tax history
Public tax history
| Year | Property taxes | Tax assessment |
|---|---|---|
| 2023 | $251 +12.5% | $4,499 |
| 2022 | $223 -5% | $4,499 |
| 2021 | $235 -76.6% | $4,499 -40.6% |
| 2020 | $1,002 -2.4% | $7,573 -11% |
| 2019 | $1,027 -39.3% | $8,509 |
| 2018 | $1,692 -19% | $8,509 -11.7% |
| 2017 | $2,087 +7.5% | $9,633 |
| 2016 | $1,942 +9.2% | $9,633 |
| 2015 | $1,778 +3.2% | $9,633 +4.6% |
| 2014 | $1,723 +2% | $9,213 |
| 2013 | $1,689 +276.5% | $9,213 +271.5% |
| 2012 | $449 -75.6% | $2,480 -78% |
| 2011 | $1,839 -0.5% | $11,272 |
| 2010 | $1,848 +4.3% | $11,272 |
| 2009 | $1,772 +20.1% | $11,272 +10.5% |
| 2008 | $1,475 +0.9% | $10,205 |
| 2007 | $1,461 -11% | $10,205 -10% |
| 2006 | $1,641 +47.5% | $11,337 +66.5% |
| 2005 | $1,112 +0.1% | $6,808 |
| 2004 | $1,112 +2.2% | $6,808 |
| 2003 | $1,088 +8.1% | $6,808 +22.7% |
| 2002 | $1,006 +3.7% | $5,547 |
| 2001 | $971 +6.8% | $5,547 |
| 2000 | $909 -0.7% | $5,547 +18.5% |
| 1999 | $915 | $4,681 |
Find assessor info on the county website
Monthly payment
Estimated monthly payment
All calculations are estimates and provided by Zillow, Inc. for informational purposes only. Actual amounts may vary.
HOA fees may include property taxes on listings classified as Co-Ops. Contact the listing agent and/or owner for fee details.
Mortgage interest rates are dependent on a number of factors, including credit score, down payment, and repayment length. Interest rate data provided by Zillow Group Marketplace, Inc. as of 1/1/1970 from various mortgage lenders with which we have lead or other similar arrangements; the Estimated Payment is an average of those rates.
See how much you could borrow to make a competitive offer.
Climate risks
Neighborhood: West Englewood
Nearby schools
GreatSchools rating
- 5/10Claremont Academy Elementary SchoolGrades: PK-8Distance: 0.3 mi
- 1/10Gage Park High SchoolGrades: 9-12Distance: 1.3 mi
Local experts in 60636
- Illinois
- Cook County
- Chicago
- 60636
- West Englewood
- 6603 S Oakley Ave
Nearby cities
Nearby neighborhoods
Nearby zip codes
Other Chicago Topics
