40 N Tower Rd, Oak Brook, IL 60523 is a single family home that contains 7,510 sq ft and was built in 1976. This home last sold for $682,500 in August 2024.
The Zestimate for this house is $1,093,700. The Rent Zestimate for this home is $3,452/mo.
Sold for $682,500
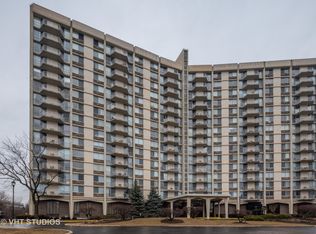
Street View
$682,500
40 N Tower Rd, Oak Brook, IL 60523
--beds
--baths
7,510sqft
SingleFamily
Built in 1976
2.4 Acres Lot
$1,093,700 Zestimate®
$91/sqft
$3,452 Estimated rent
Home value
$1,093,700
$842,000 - $1.42M
$3,452/mo
Zestimate® history
Owner options
List your home for rent
$3,452/mo
Rent Zestimate®
Find your next renter with Zillow Rental Manager. Plus, with online applications, you can quickly screen prospective tenants – for free.
$3,452/mo
Rent Zestimate®
Refinance and save
$4,285/mo
Est. payment
Refinancing to a lower rate could help reduce your monthly payments and save thousands over the life of the loan.
$4,285/mo
Est. payment
Explore your selling options
Work with a Zillow partner agent
Leverage their expertise and Zillow's premium Showcase listings to get your home seen by more buyers.
Get startedList with your own agent
Get your home in front of millions of buyers by listing it on Zillow.
Learn how to do itSell it yourself
Take full control of how buyers see your home on Zillow by listing For Sale by Owner (FSBO).
List your homeWhat's special
Facts & features
Interior
Interior area
- Total interior livable area: 7,510 sqft
Property
Lot
- Size: 2.4 Acres
Details
- Parcel number: 0628107346
Construction
Type & style
- Home type: SingleFamily
Condition
- Year built: 1976
Community & HOA
HOA
- Has HOA: Yes
- HOA fee: $302 monthly
Location
- Region: Oak Brook
Financial & listing details
- Price per square foot: $91/sqft
- Tax assessed value: $507,415
- Annual tax amount: $37,660
Price history
| Date | Event | Price |
|---|---|---|
| 8/15/2024 | Sold | $682,500+210.2%$91/sqft |
Source: Public Record Report a problem | ||
| 10/29/2021 | Sold | $220,000+63%$29/sqft |
Source: @Properties sold #11204971_60523_15G Report a problem | ||
| 9/9/2021 | Sold | $135,000-30.8%$18/sqft |
Source: @Properties sold #11165118_60523_7E Report a problem | ||
| 5/4/2021 | Sold | $195,000+50.2%$26/sqft |
Source: DAprile Properties #11030412_60523_12N Report a problem | ||
| 7/31/2020 | Sold | $129,800+9.1%$17/sqft |
Source: Berkshire Hathaway HomeServices Koenig Rubloff #10757714_60523_16D Report a problem | ||
| 3/19/2020 | Sold | $119,000-14.4%$16/sqft |
Source: @Properties sold #10608152_60523_14H Report a problem | ||
| 11/22/2019 | Sold | $139,000+85.3%$19/sqft |
Source: @Properties sold #10537452_60523_12B Report a problem | ||
| 7/29/2016 | Sold | $75,000-21.9%$10/sqft |
Source: Berkshire Hathaway HomeServices Koenig Rubloff #09205604_60523 Report a problem | ||
| 5/24/2016 | Sold | $96,000+0.5%$13/sqft |
Source: Baird & Warnerc #09143665_60523_5E Report a problem | ||
| 12/7/2015 | Sold | $95,500-2.1%$13/sqft |
Source: Berkshire Hathaway HomeServices Koenig Rubloff #09039444_60523_4D Report a problem | ||
| 7/1/2015 | Sold | $97,500-6.2%$13/sqft |
Source: Baird & Warnerc #08729523_60523_7B Report a problem | ||
| 3/13/2015 | Sold | $103,900-86.3%$14/sqft |
Source: Baird & Warnerc #08769906_60523_9D Report a problem | ||
| 12/2/2014 | Sold | $760,000+1364.4%$101/sqft |
Source: Public Record Report a problem | ||
| 8/1/2013 | Sold | $51,900-40.7%$7/sqft |
Source: Berkshire Hathaway HomeServices Koenig Rubloff #08326222_60523_9C Report a problem | ||
| 3/4/2013 | Sold | $87,500+16.7%$12/sqft |
Source: @Properties sold #08249648_60523_14D Report a problem | ||
| 8/30/2011 | Sold | $75,000-88.7%$10/sqft |
Source: Berkshire Hathaway HomeServices Koenig Rubloff #07526419_60523_10H Report a problem | ||
| 2/4/2004 | Sold | $665,000$89/sqft |
Source: Public Record Report a problem | ||
Public tax history
| Year | Property taxes | Tax assessment |
|---|---|---|
| 2024 | $37,660 +49.7% | $507,415 +53% |
| 2023 | $25,161 -24% | $331,700 -25.7% |
| 2022 | $33,125 +15.2% | $446,530 +14.2% |
| 2021 | $28,763 -8.4% | $391,050 -8.2% |
| 2020 | $31,399 +5.5% | $425,890 +5.2% |
| 2019 | $29,759 +0.1% | $404,920 +5.6% |
| 2018 | $29,737 -19.6% | $383,300 -18.6% |
| 2017 | $36,976 +0.1% | $470,630 +6.1% |
| 2016 | $36,923 -35.2% | $443,370 -31.5% |
| 2015 | $57,000 +5.1% | $647,650 +6% |
| 2014 | $54,228 +1.9% | $610,990 -1.4% |
| 2013 | $53,194 +3.3% | $619,600 -6.2% |
| 2012 | $51,510 +5.7% | $660,340 -7.9% |
| 2011 | $48,722 +6.9% | $716,980 -1.6% |
| 2010 | $45,566 +3.4% | $728,430 -6.8% |
| 2009 | $44,049 +2.7% | $781,580 |
| 2008 | $42,885 | $781,580 |
Find assessor info on the county website
Neighborhood: 60523
Nearby homes
- $233,4002 bd2 ba1.3k sqft40 N Tower Rd SUITE 2-A, Oak Brook, IL 60523Off Market
- $231,100-- bd-- ba1.3k sqft40 N Tower Rd APT 3A, Oak Brook, IL 60523Off Market
- $209,500-- bd-- ba1.3k sqft40 N Tower Rd APT 4A, Oak Brook, IL 60523Off Market
- $229,9002 bd2 ba-- sqft40 N Tower Rd APT 5A, Oak Brook, IL 60523For Sale

- $247,3002 bd2 ba1.3k sqft40 N Tower Rd APT 6A, Oak Brook, IL 60523Off Market
- $231,3002 bd2 ba1.3k sqft40 N Tower Rd APT 7A, Oak Brook, IL 60523Off Market
- $220,3002 bd2 ba1.3k sqft40 N Tower Rd APT 8A, Oak Brook, IL 60523Off Market
- $239,9002 bd2 ba1.3k sqft40 N Tower Rd APT 9A, Oak Brook, IL 60523Off Market
- $211,600-- bd-- ba1.3k sqft40 N Tower Rd APT 10A, Oak Brook, IL 60523Off Market
Nearby schools
GreatSchools rating
- NAStevenson SchoolGrades: K-2Distance: 0.7 mi
- 4/10Jackson Middle SchoolGrades: 6-8Distance: 1.7 mi
- 9/10Willowbrook High SchoolGrades: 9-12Distance: 1.4 mi
Get a cash offer in 3 minutes
Find out how much your home could sell for in as little as 3 minutes with a no-obligation cash offer.
Estimated market value
$1,093,700
Get a cash offer in 3 minutes
Find out how much your home could sell for in as little as 3 minutes with a no-obligation cash offer.
Estimated market value
$1,093,700
- Illinois
- DuPage County
- Oak Brook
- 60523
- 40 N Tower Rd
Nearby cities
Nearby zip codes
Other Oak Brook Topics
