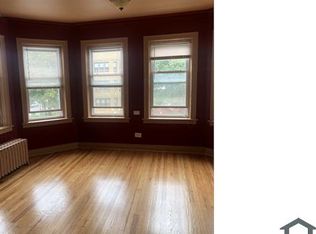
This traditional style single family home offers 3 bedrooms and 2.1 bathrooms with approximately 2513 square feet of living space on a 0.12 acre lot. No Buyer Premium on this property. The buyer has the right to select their own title/closing company. The buyer is responsible for all closing costs in this transaction. It is a criminal offense to trespass on this property
Auction

Est. $286,200
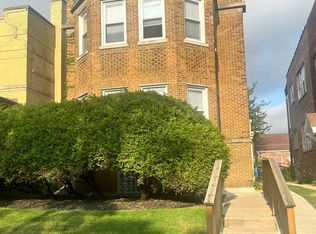
7310 S Constance Ave, Chicago, IL 60649
3beds
2,513sqft
Single Family Residence
Built in 1928
5,227.2 Square Feet Lot
$286,200 Zestimate®
$--/sqft
$-- HOA
Overview
- 275 days |
- 99 |
- 6 |
Zillow last checked: 15 hours ago
Source: Xome
Facts & features
Interior
Bedrooms & bathrooms
- Bedrooms: 3
- Bathrooms: 3
- Full bathrooms: 2
- 1/2 bathrooms: 1
Features
- Has basement: No
Interior area
- Total structure area: 2,513
- Total interior livable area: 2,513 sqft
Property
Parking
- Total spaces: 1
Lot
- Size: 5,227.2 Square Feet
Details
- Parcel number: 2025127004
- Special conditions: Auction
Construction
Type & style
- Home type: SingleFamily
- Property subtype: Single Family Residence
Condition
- Year built: 1928
Community & HOA
Location
- Region: Chicago
Financial & listing details
- Tax assessed value: $173,550
- Annual tax amount: $2,973
- Date on market: 7/1/2025
- Lease term: Contact For Details
This listing is brought to you by Xome
View Auction DetailsEstimated market value
$286,200
$235,000 - $338,000
$3,161/mo
Public tax history
Public tax history
| Year | Property taxes | Tax assessment |
|---|---|---|
| 2023 | $2,973 -12.8% | $17,355 -13.2% |
| 2022 | $3,410 +1.7% | $20,000 |
| 2021 | $3,352 -3.2% | $20,000 +7.3% |
| 2020 | $3,462 -0.3% | $18,645 -10% |
| 2019 | $3,473 +1.7% | $20,717 |
| 2018 | $3,414 -7.8% | $20,717 +0.7% |
| 2017 | $3,702 -19.7% | $20,572 -10.6% |
| 2016 | $4,610 +9.3% | $23,016 |
| 2015 | $4,218 +6.5% | $23,016 +7.8% |
| 2014 | $3,961 +2% | $21,347 |
| 2013 | $3,882 +1.4% | $21,347 |
| 2012 | $3,831 +19.1% | $21,347 +7.5% |
| 2011 | $3,217 -0.4% | $19,852 |
| 2010 | $3,230 +4.4% | $19,852 |
| 2009 | $3,096 -14.6% | $19,852 -21.4% |
| 2008 | $3,625 +1% | $25,273 |
| 2007 | $3,589 -1.1% | $25,273 |
| 2006 | $3,628 +28.6% | $25,273 +46.4% |
| 2005 | $2,821 +1% | $17,263 |
| 2004 | $2,792 +2.2% | $17,263 |
| 2003 | $2,732 +6.1% | $17,263 +20.4% |
| 2002 | $2,576 +3.8% | $14,337 |
| 2001 | $2,483 +1.1% | $14,337 |
| 2000 | $2,455 | $14,337 +12.2% |
| 1999 | -- | $12,778 |
Find assessor info on the county website
Climate risks
Neighborhood: South Shore
Nearby schools
GreatSchools rating
- 3/10Bouchet Elementary Math & Science AcademyGrades: PK-8Distance: 0.3 mi
- 2/10South Shore Intl Col Prep High SchoolGrades: 9-12Distance: 0.4 mi
- 1/10Chicago Vocational Career Academy High SchoolGrades: 9-12Distance: 1.7 mi
- Illinois
- Cook County
- Chicago
- 60649
- South Shore
- 7310 S Constance Ave
Nearby cities
Nearby neighborhoods
Nearby zip codes
Other Chicago Topics
