$148,800
3 bd|1 ba|1.1k sqft
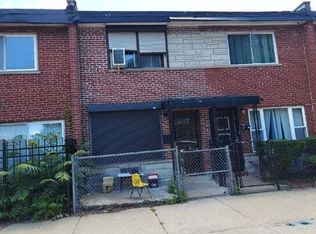
7701 S Damen Ave, Chicago, IL 60620
Off Market
Zillow last checked:
Michael Tassone 312-446-8713,
DNV Solutions LLC
Not available
Estimated sales range
Not available
$1,955/mo
| Date | Event | Price |
|---|---|---|
| 1/30/2025 | Listing removed | $169,873$144/sqft |
Source: | ||
| 1/10/2025 | Listed for sale | $169,873$144/sqft |
Source: | ||
| 12/10/2024 | Listing removed | $169,873$144/sqft |
Source: | ||
| 9/27/2024 | Price change | $169,873-5.6%$144/sqft |
Source: | ||
| 9/12/2024 | Listed for sale | $179,873$153/sqft |
Source: | ||
| 9/8/2024 | Contingent | $179,873$153/sqft |
Source: | ||
| 8/28/2024 | Listed for sale | $179,873+25.8%$153/sqft |
Source: | ||
| 2/14/2018 | Sold | $143,000-1.3%$121/sqft |
Source: Public Record Report a problem | ||
| 12/19/2017 | Pending sale | $144,900$123/sqft |
Source: Keller Williams Preferred Realty #09807783 Report a problem | ||
| 11/28/2017 | Price change | $144,900-3.3%$123/sqft |
Source: Keller Williams Preferred Realty #09807783 Report a problem | ||
| 10/4/2017 | Listed for sale | $149,900+487.8%$127/sqft |
Source: Keller Williams Preferred Realty #09807783 Report a problem | ||
| 4/24/2017 | Sold | $25,500$22/sqft |
Source: Public Record Report a problem | ||
| Year | Property taxes | Tax assessment |
|---|---|---|
| 2024 | -- | $11,000 -15.4% |
| 2023 | $2,743 +2.6% | $13,000 |
| 2022 | $2,674 +2.3% | $13,000 |
| 2021 | $2,614 +2.9% | $13,000 +14% |
| 2020 | $2,540 -0.2% | $11,401 -10% |
| 2019 | $2,545 +1.7% | $12,668 |
| 2018 | $2,502 +5.4% | $12,668 +14.8% |
| 2017 | $2,375 +7.5% | $11,031 |
| 2016 | $2,209 +1418.4% | $11,031 |
| 2015 | $146 +0.9% | $11,031 +2.4% |
| 2014 | $144 -0.4% | $10,770 |
| 2013 | $145 +6.8% | $10,770 |
| 2012 | $136 -89.5% | $10,770 -19.2% |
| 2011 | $1,287 -40.7% | $13,328 |
| 2010 | $2,169 +124.1% | $13,328 |
| 2009 | $968 +15% | $13,328 -4.3% |
| 2008 | $842 +200% | $13,925 |
| 2007 | $281 -5.8% | $13,925 |
| 2006 | $298 -71.3% | $13,925 +32.7% |
| 2005 | $1,038 +25% | $10,496 |
| 2004 | $830 -14.9% | $10,496 |
| 2003 | $975 +88.1% | $10,496 +38.9% |
| 2002 | $518 -6.6% | $7,558 |
| 2001 | $554 -24% | $7,558 |
| 2000 | $729 +15.4% | $7,558 +9.4% |
| 1999 | $632 | $6,906 |
Source: MRED as distributed by MLS GRID. This data may not be complete. We recommend contacting the local school district to confirm school assignments for this home.
A local agent can set up tours, give advice and negotiate with sellers.
A local lender can help you make sure your offer is ready when you are.