$229,400
-- bd|1 ba|1k sqft
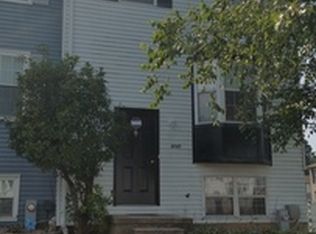
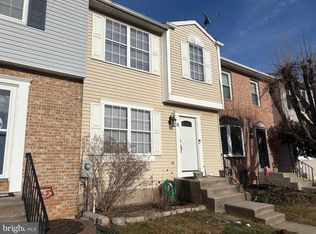
4051 Rustico Rd, Baltimore, MD 21220
Off Market
Zillow last checked: 8 hours ago
Listing updated: 15 hours ago
Debra (Debbie) Rettberg 410-404-9038,
Northrop Realty 4107702910,
Listing Team: The Key Team
$253,700
$241,000 - $266,000
$1,917/mo
| Date | Event | Price |
|---|---|---|
| 3/15/2017 | Sold | $161,500-2.1%$112/sqft |
Source: Public Record Report a problem | ||
| 8/11/2016 | Price change | $164,999-2.9%$114/sqft |
Source: Certified Home Specialists Realty Inc. #BC8684754 Report a problem | ||
| 8/7/2016 | Price change | $170,000+3%$118/sqft |
Source: Certified Home Specialists Realty Inc. #BC8684754 Report a problem | ||
| 12/30/2015 | Price change | $164,999-1.5%$114/sqft |
Source: Certified Home Specialists Realty Inc. #BC8684754 Report a problem | ||
| 9/25/2015 | Price change | $167,500-0.9%$116/sqft |
Source: Certified Home Specialists Realty Inc. #BC8684754 Report a problem | ||
| 7/4/2015 | Listed for sale | $169,000+28.1%$117/sqft |
Source: Certified Home Specialists Realty Inc. #BC8684754 Report a problem | ||
| 4/27/2011 | Sold | $131,900+4.3%$91/sqft |
Source: Public Record Report a problem | ||
| 6/16/2010 | Sold | $126,450-15.6%$88/sqft |
Source: Public Record Report a problem | ||
| 8/1/2009 | Price change | $149,900+7.1%$104/sqft |
Source: CENTURY 21 American Patriot Realty #BC7078497 Report a problem | ||
| 6/27/2009 | Price change | $139,900-12.5%$97/sqft |
Source: CENTURY 21 American Patriot Realty #BC7078497 Report a problem | ||
| 6/22/2009 | Price change | $159,900+6.7%$111/sqft |
Source: CENTURY 21 American Patriot Realty #BC7078497 Report a problem | ||
| 6/20/2009 | Listed for sale | $149,900+53.7%$104/sqft |
Source: CENTURY 21 American Patriot Realty #BC7078497 Report a problem | ||
| 9/3/2002 | Sold | $97,500$68/sqft |
Source: Public Record Report a problem | ||
| Year | Property taxes | Tax assessment |
|---|---|---|
| 2025 | $3,376 +50.5% | $200,000 +8% |
| 2024 | $2,243 +8.8% | $185,100 +8.8% |
| 2023 | $2,063 +3.2% | $170,200 |
| 2022 | $1,999 +3.3% | $170,200 +6.6% |
| 2021 | $1,934 +3.4% | $159,600 +3.4% |
| 2020 | $1,870 +3.9% | $154,300 |
| 2019 | $1,801 +4% | $154,300 +8% |
| 2018 | $1,731 +4.2% | $142,833 +4.2% |
| 2017 | $1,662 -38.5% | $137,100 +1% |
| 2016 | $2,701 | $135,800 +1% |
| 2015 | $2,701 | $134,500 +1% |
| 2014 | $2,701 | $133,200 |
| 2013 | -- | $133,200 |
| 2012 | -- | $133,200 -24.4% |
| 2011 | -- | $176,200 +2.3% |
| 2010 | -- | $172,236 +2.4% |
| 2009 | -- | $168,273 +2.4% |
| 2008 | -- | $164,310 +17.7% |
| 2007 | -- | $139,642 +21.5% |
| 2006 | -- | $114,976 +27.3% |
| 2005 | -- | $90,310 +3.8% |
| 2004 | -- | $87,042 +3.9% |
| 2003 | -- | $83,776 +4.1% |
| 2002 | -- | $80,510 +0.4% |
| 2001 | -- | $80,202 |
Find assessor info on the county website
Source: Bright MLS. This data may not be complete. We recommend contacting the local school district to confirm school assignments for this home.